Why: abstracting the tasks
MIDS W209: Information Visualization
John Alexis Guerra Gómez | john.guerra[at]gmail.com | @duto_guerra
https://johnguerra.co/lectures/MIDS_W209_Information_Visualization/03_Why/
https://johnguerra.co/lectures/MIDS_W209_Information_Visualization/03_Why/

Partially based on slides from Tamara Munzner
What we are going to learn
- Abstracting the tasks (why)
- Define the verb of the task (action)
- Define the noun of the task (targets)
- Tasks good practices
- Deriving new data
Abstracting the tasks (Why)
Why analyze tasks?
- Abstract tasks are domain-independent
- Two different domain problems 👉 same task abstraction 👉 same solution
- Visualization idioms are good for some tasks and bad for others
Task construction
Action (verb)
+
Target (noun)
Actions
verbs
Actions: Levels
Three levels:
- Analyze
- Search
- Query
Try being specific
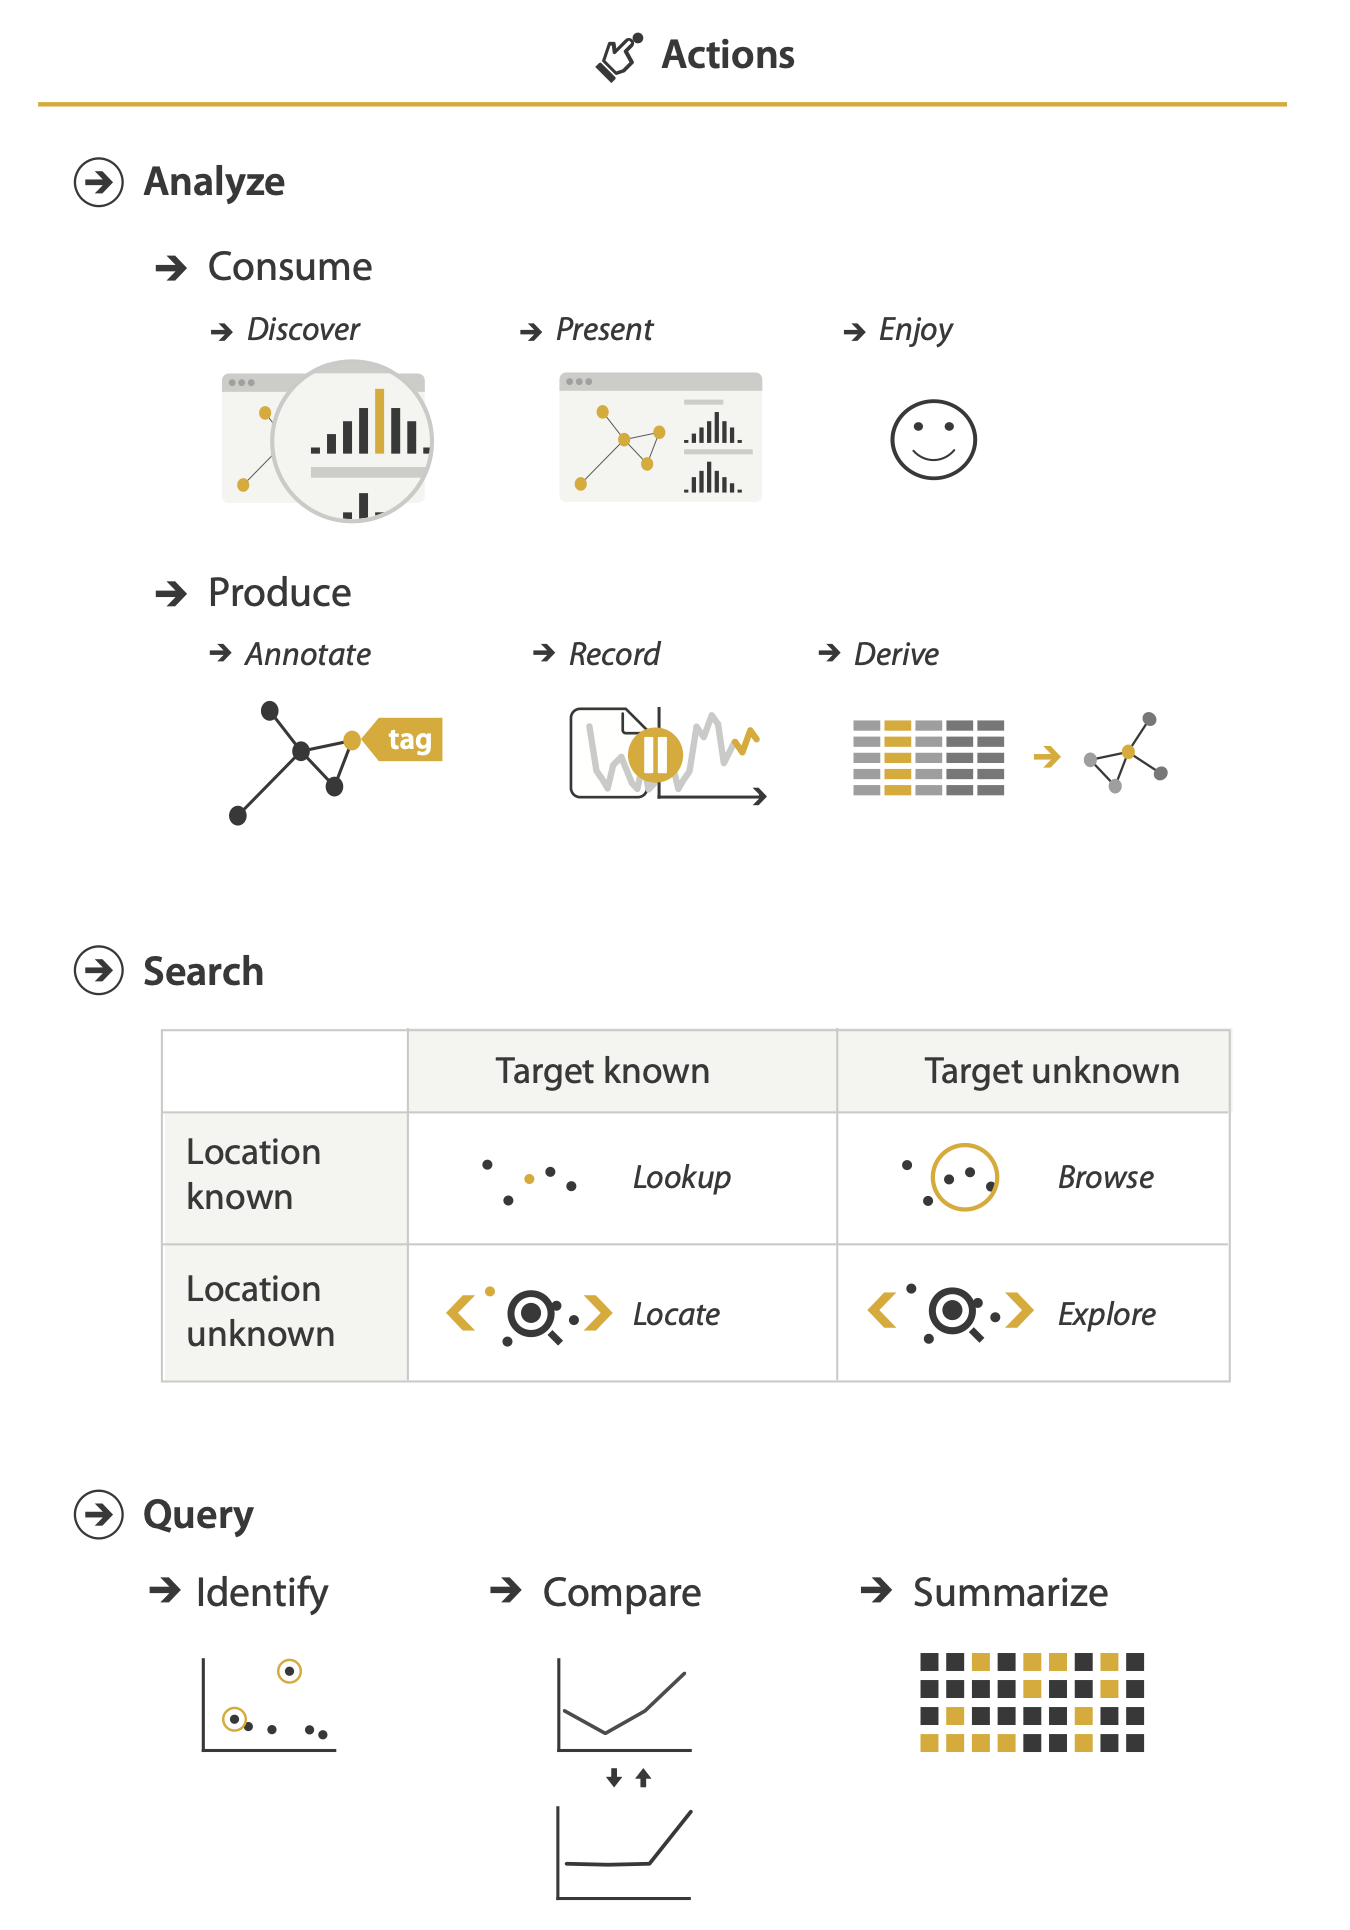
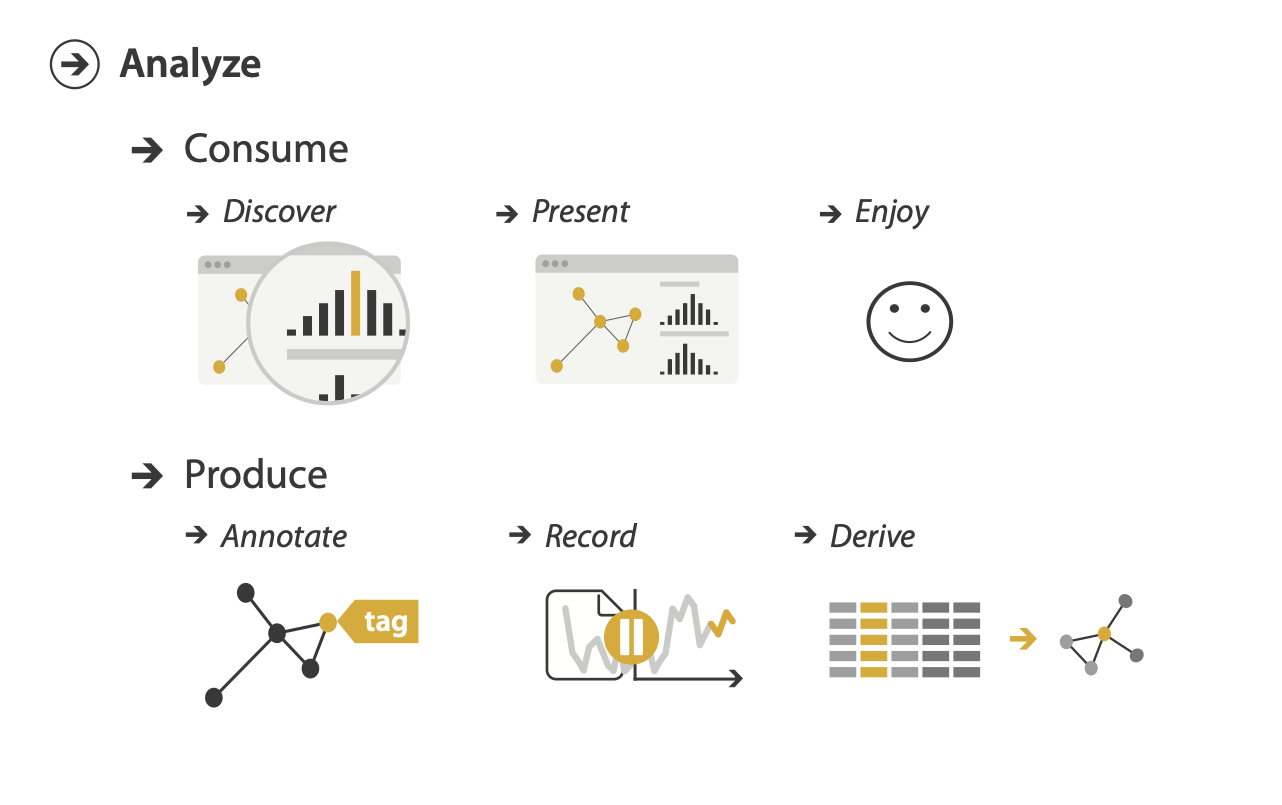
Actions: Analyze, High-level
- Consume
- Discover vs. present
- Enjoy
- Produce
- Annotate, record
- Derive
Actions: Search, Mid-level
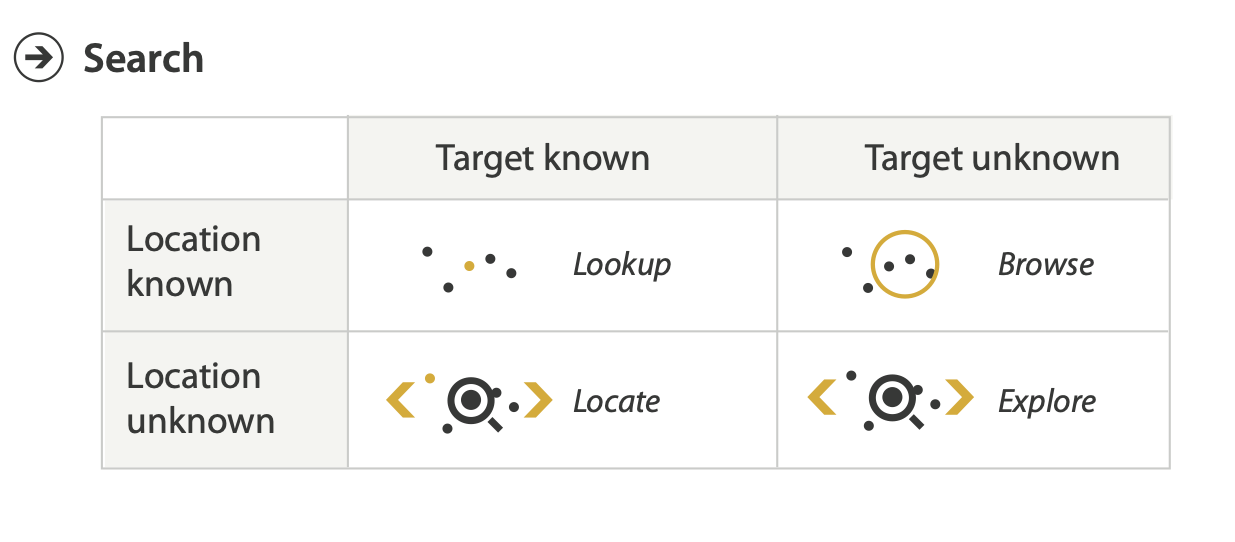
- Target
- I know what I'm looking for
- E.g., what's the salary of the CEO? 👆 Target known
- E.g., who has the highest salary? 👆 Target unknown
Actions: Search, Mid-level
- Location
- I know where the mark is going to be located in the chart
- Scales ordered alphabetically
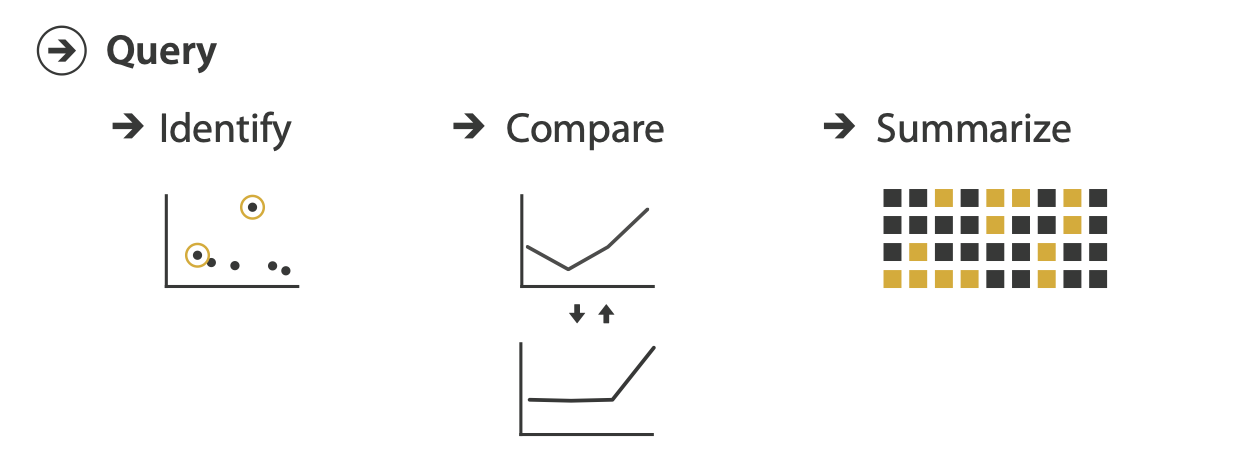
Actions: Query, Low-level
How much of the data matter?
- One 👉 identify
- Some 👉 compare
- All 👉 summarize
Targets
nouns
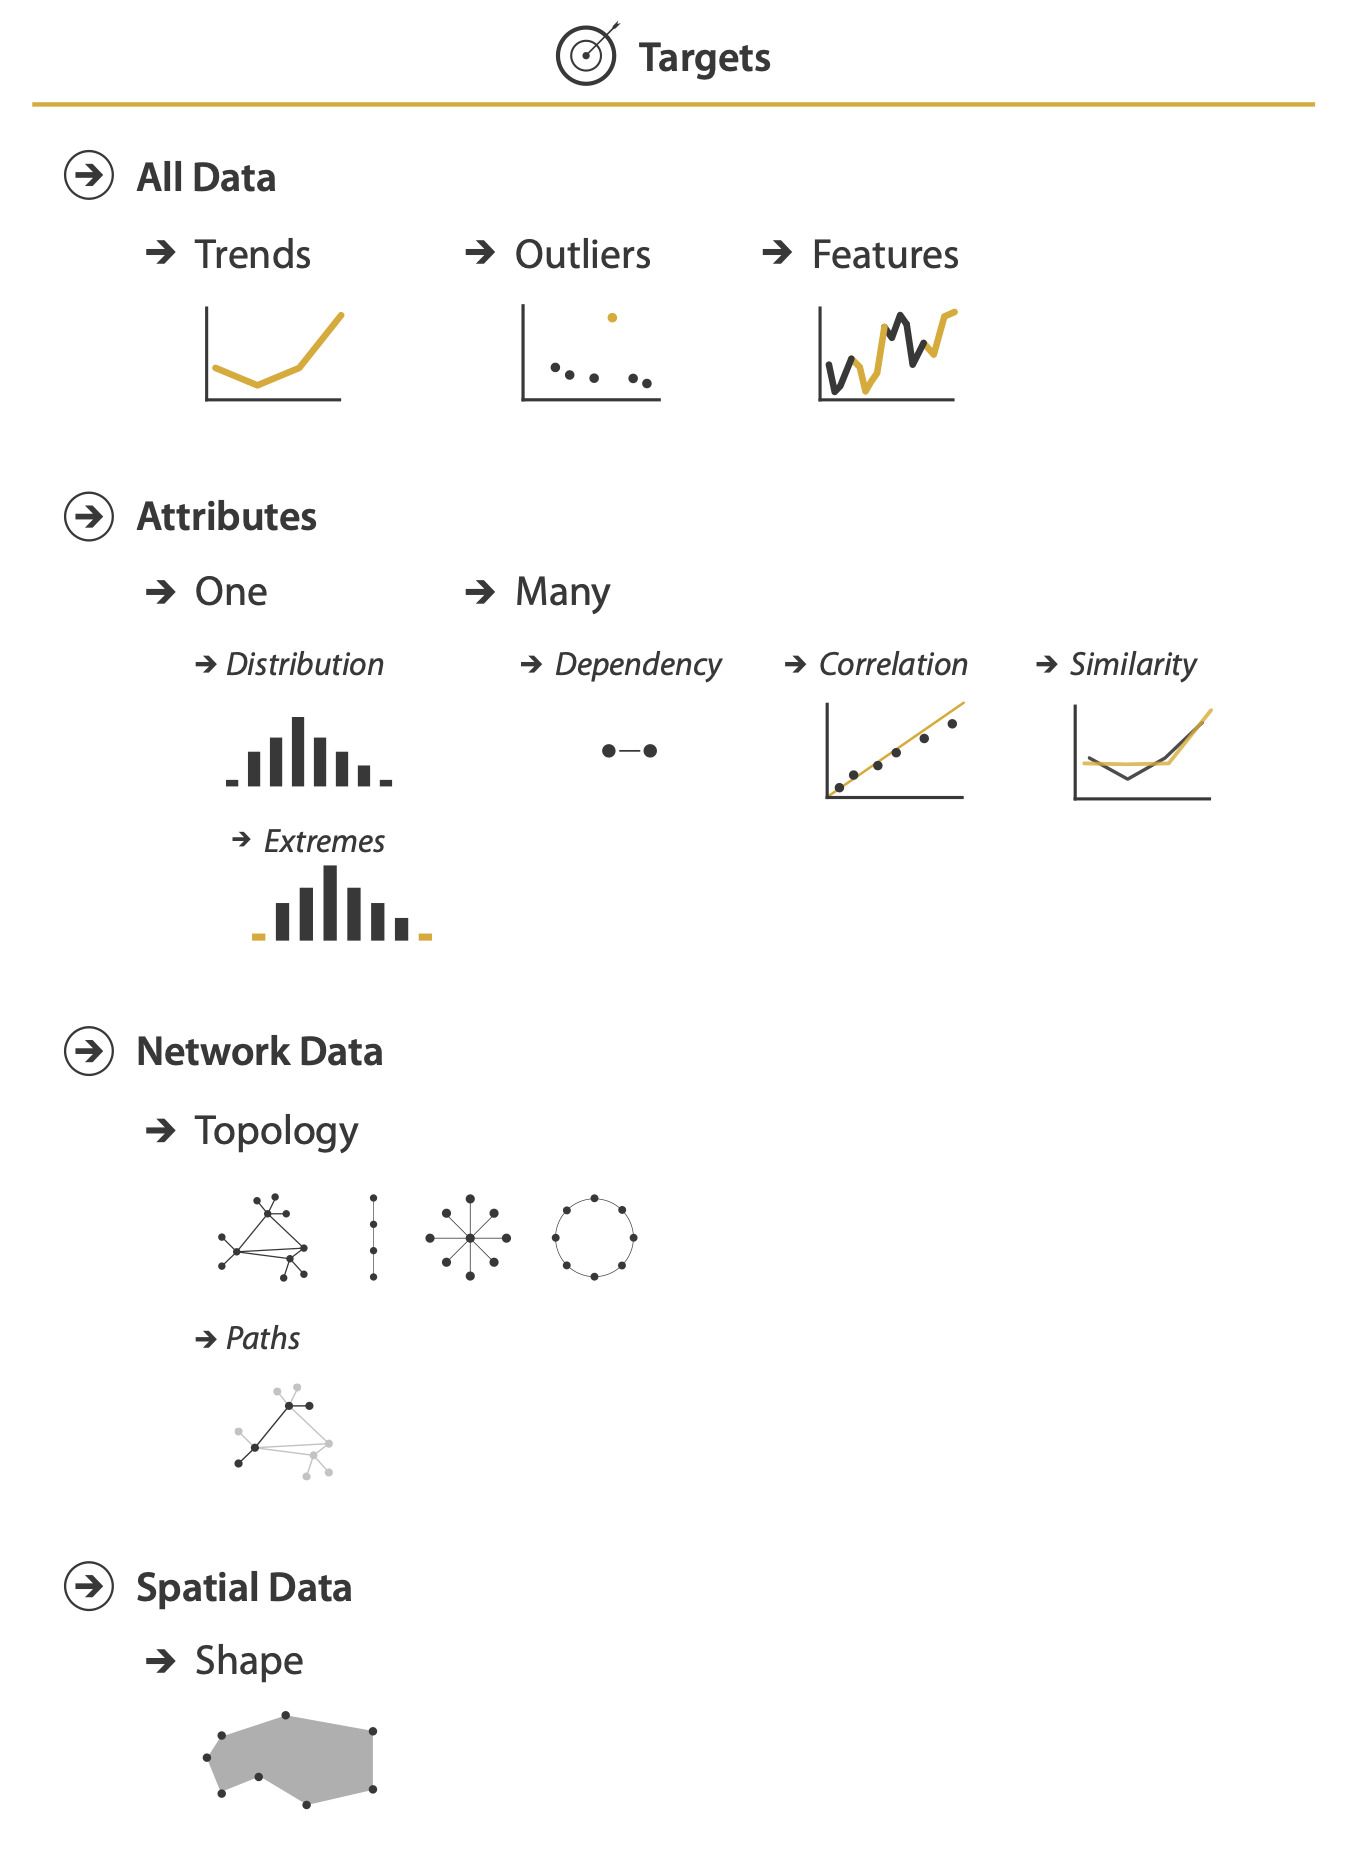
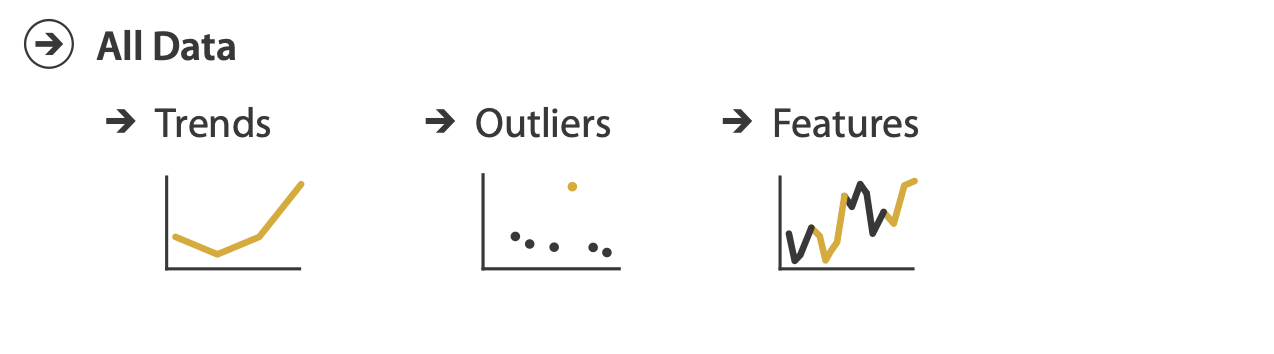
Targets: Trends, outliers, features
- Trends (or patterns): e.g., are sales increasing?
- Outliers: one or some that aren't like the others
- Features: 👉 task-dependent (e.g., a V-shaped recession)
One Attribute: Distributions, Extremes
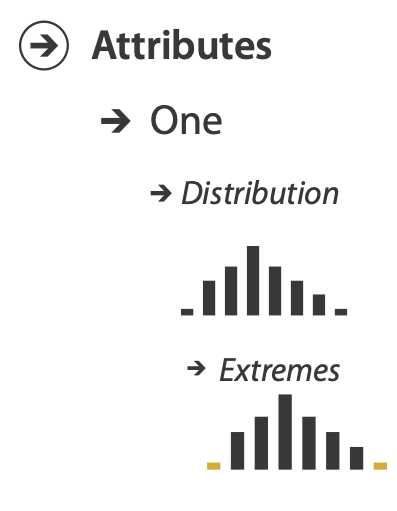
- Distribution (e.g., GDP distribution across multiple countries)
- Extremes (e.g., country with highest GDP)
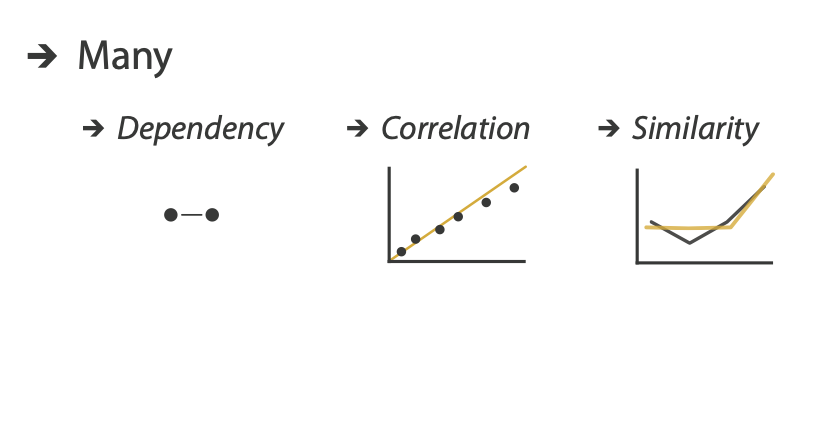
Many Attributes: Dependency, Correlation, Similarity
- Dependency (e.g., do all NBA players attended college?)
- Correlation (e.g., do higher-paid players score more?)
- Similarity (e.g., do Curry and Hardem shoot the same?)
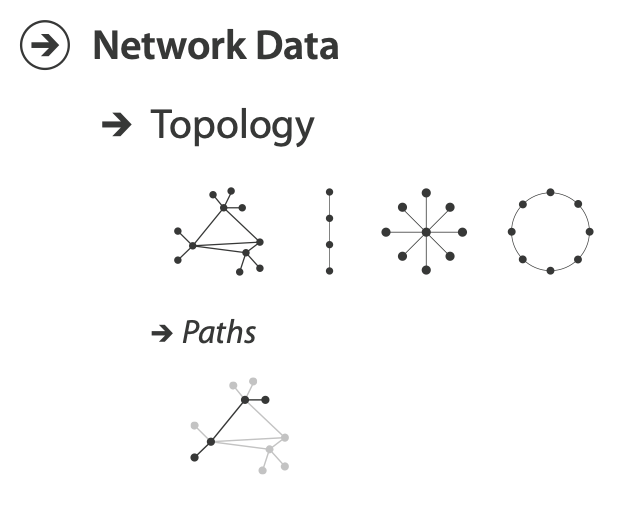
Networks: Topology and Shape
- Topology (e.g., do all my classmates follow each other?)
- Paths (e.g., who do I know on LinkedIn that knows Bill Gates?)
Targets: Spatial data
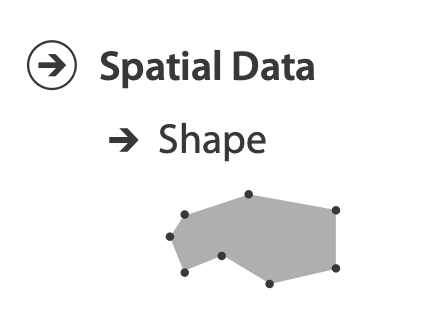
- Shape (e.g., is there a park within 100 feet of every school?)
Good practices
- Be specific
- Is your task measurable?
- Number your tasks
- Use Tamara's grammar
- Describe specific attributes used
- Don't think about the visuals
- T1: Summarize the stock market prices for the S&P 500 companies (Summarize, Distribution)
- T2: Identify the most profitable books for the last year (Identify, Features)
- T3: Compare the trends of COVID-19 deaths in the world (Compare, Trend)
Abstraction examples:
Policy makers in California want to test what counties had flattened the curve in the Covid 19 pandemic.
T1. Compare the (shape of the curves of the) number of positive cases per day over time between counties (compare, trend/features)
Economists want to classify what type of recession was generated by the Covid 19 pandemic in different countries
T2. Compare the shape of the GDP over time per country (compare, trend/features)
Example insights
Santa Guerra County has been the best at flattening the curve in California, with a reduction of 37% of their expected deaths by June 15, 2020.
T1. Compare the (shape of the curves of the) number of positive cases per day over time between counties (compare, trend/features)
Example insights
- Imagine what the visualization users could be able to discover
- Made up
- Include details (names and/or numbers)
- Are very specific
- Can be tested
- Can be led to action
Deriving new data
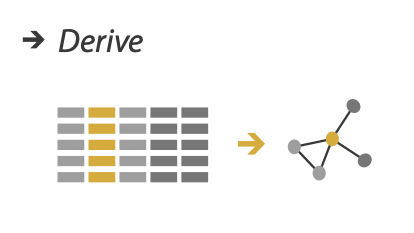
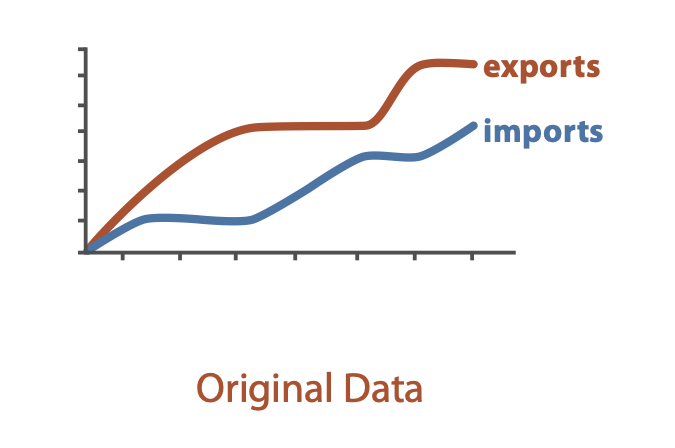
Don't make the user compute it in their head.
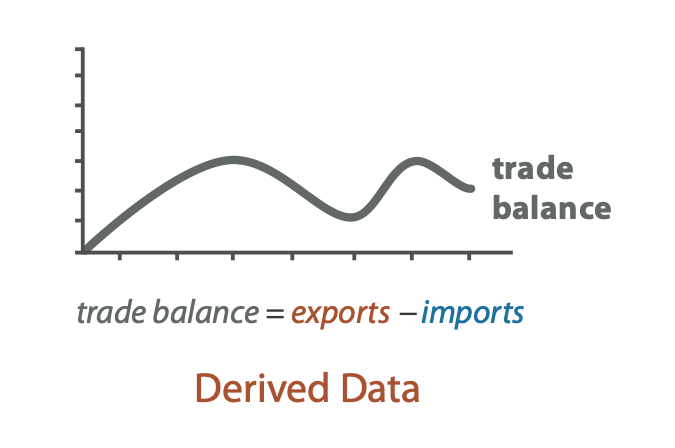
Instead, display the difference.
When to derive data
- Large data? 👉 Aggregate
- Complex data? 👉 Simplify
- Dimensionality reduction
- Network/tree analytics (clusters, centralities)
- Don't make the user think!
What we learned
- Abstracting the tasks (why)
- Define the verb of the task (action)
- Define the noun of the task (targets)
- Tasks good practices
- Deriving new data