Networks and Color
MIDS W209: Information Visualization
John Alexis Guerra Gómez | john.guerra[at]gmail.com | @duto_guerra
Andy Reagan | andy[at]andyreagan.com | @andyreagan
https://johnguerra.co/lectures/MIDS_W209_Information_Visualization/08_Networks_and_Trees/
Andy Reagan | andy[at]andyreagan.com | @andyreagan
https://johnguerra.co/lectures/MIDS_W209_Information_Visualization/08_Networks_and_Trees/

Partially based on slides from Tamara Munzner
Arrange Networks and Trees
What We Are Going to Learn
- How to recognize, create, and store networks
- Algorithms to visualize network data
- How to use color
Networks: Basics
Define Networks
Networks are defined by two things: nodes and links.
Nodes: a collection of entities which have properties that are somehow related to each other
- E.g., people, forks in rivers, proteins, web pages, organisms, etc.
Edges: connections between nodes
- Links may be directed or undirected
- Links may be binary or weighted
Just Some Examples
- Tournaments
- Organization charts
- Genealogy
- Diagramming (e.g., Visio)
- Biological interactions (genes, proteins)
- Computer networks
- Social networks
- Simulation and modeling
- Integrated circuit design
- River systems
- Many, many more (and some history)
How to Store Network Data
- Node and link files
- Adjacency matrix
- Nested: XML/JSON
- Flat
- Many others: list of formats from NetworkX
Node and Link Files

Node and Link Files (cont.)

Adjacency Matrix

Nested: XML/JSON

How to Create Network Data
- Group by common attribute.
- Identify nodes, extract links.
From Flat Data
Say we have tabular data for Les Miserables with columns for "scene", "character", and "line". We want to examine the network of which characters co-occur in scenes. Take all unique characters are nodes and link between all characters in a scene together.
- JS:
d3.nest().key(function(d) { return d.scene; }). - Python:
pd.groupby('scene').
Identify Nodes, Extract Links
Social network data extract
- Loop through all of the messages.
- Add to a list of all users.
- Add to an edge list that has all "mentions" of another user.
Networks: Force Simulations
Idiom: Force-Directed Placement
- Visual encoding:
- Link connection marks, node point marks
- Tasks:
- Explore topology; locate paths, clusters
- Scalability:
- Node/edge density E < 4N
- Considerations:
- Spatial position no meaning directly encoded
- Proximity semantics?
Force simulation explained
Force in a Box
Use the Force!
Beeswarm Plot
Collision Detection
D3 Force in the wild
Matrix Representations
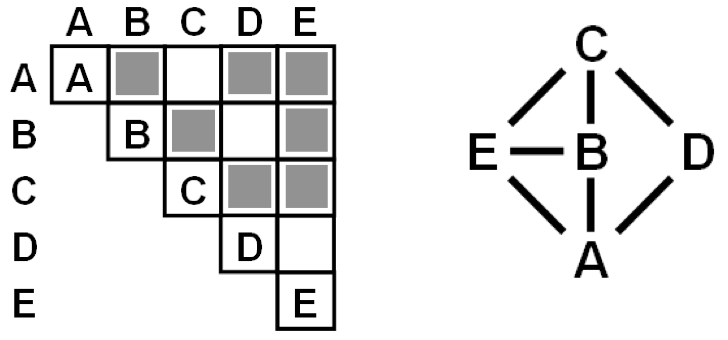
Idiom: Adjacency Matrix View
- Data: network
- Transform into same data/encoding as heatmap
- Derived data: table from network
- One quantitative attribute
- Weighted edge between nodes
- Two categorical attributes: node list x 2
- One quantitative attribute
- Visual encoding:
- Cell shows presence/absence of edge
- Tasks:
- Identify clusters (topology)
- Summarize topology/distribution
- Scalability:
- 1,000 nodes, one million edges
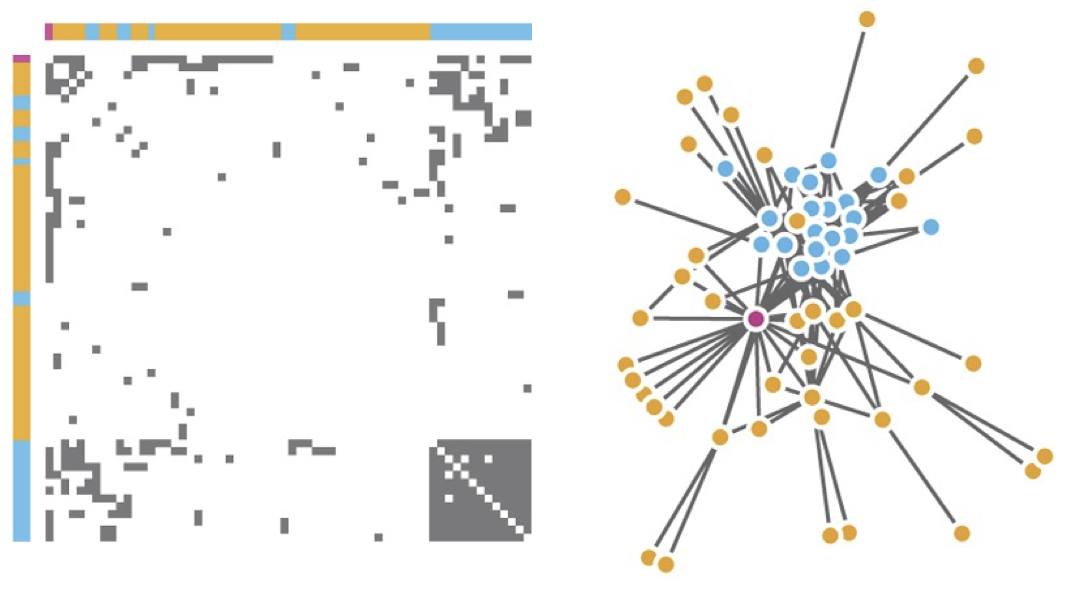
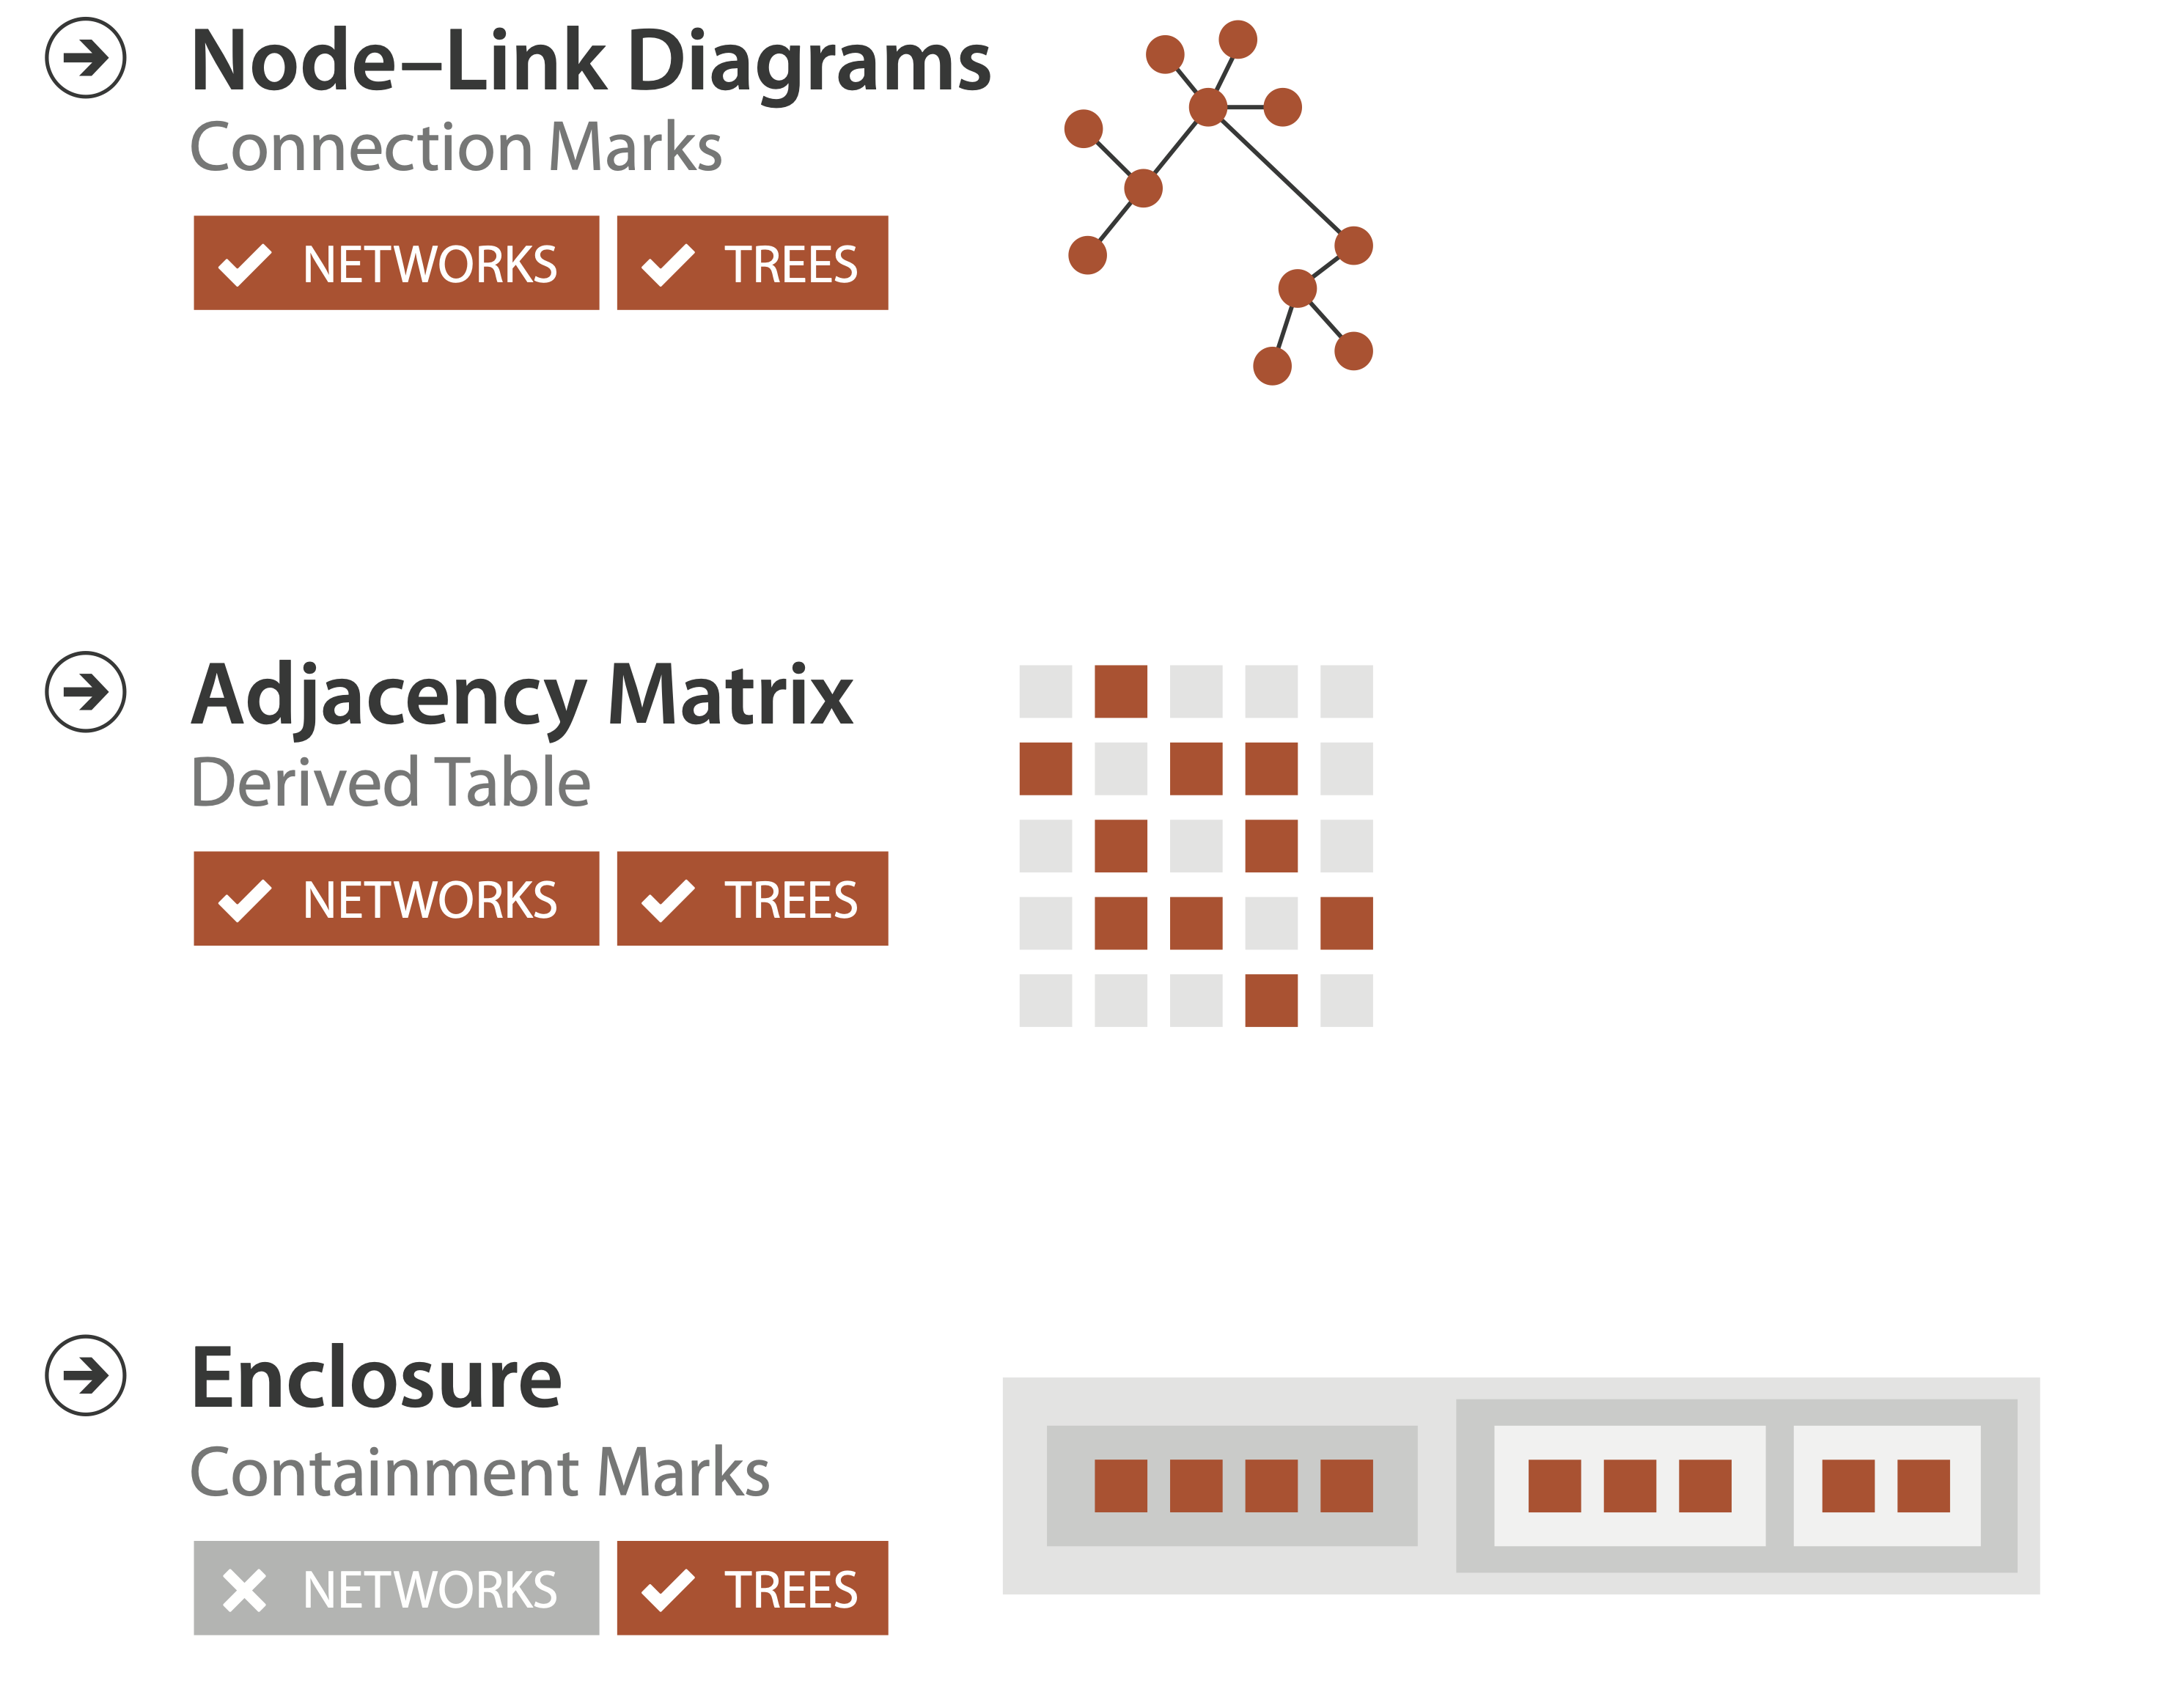
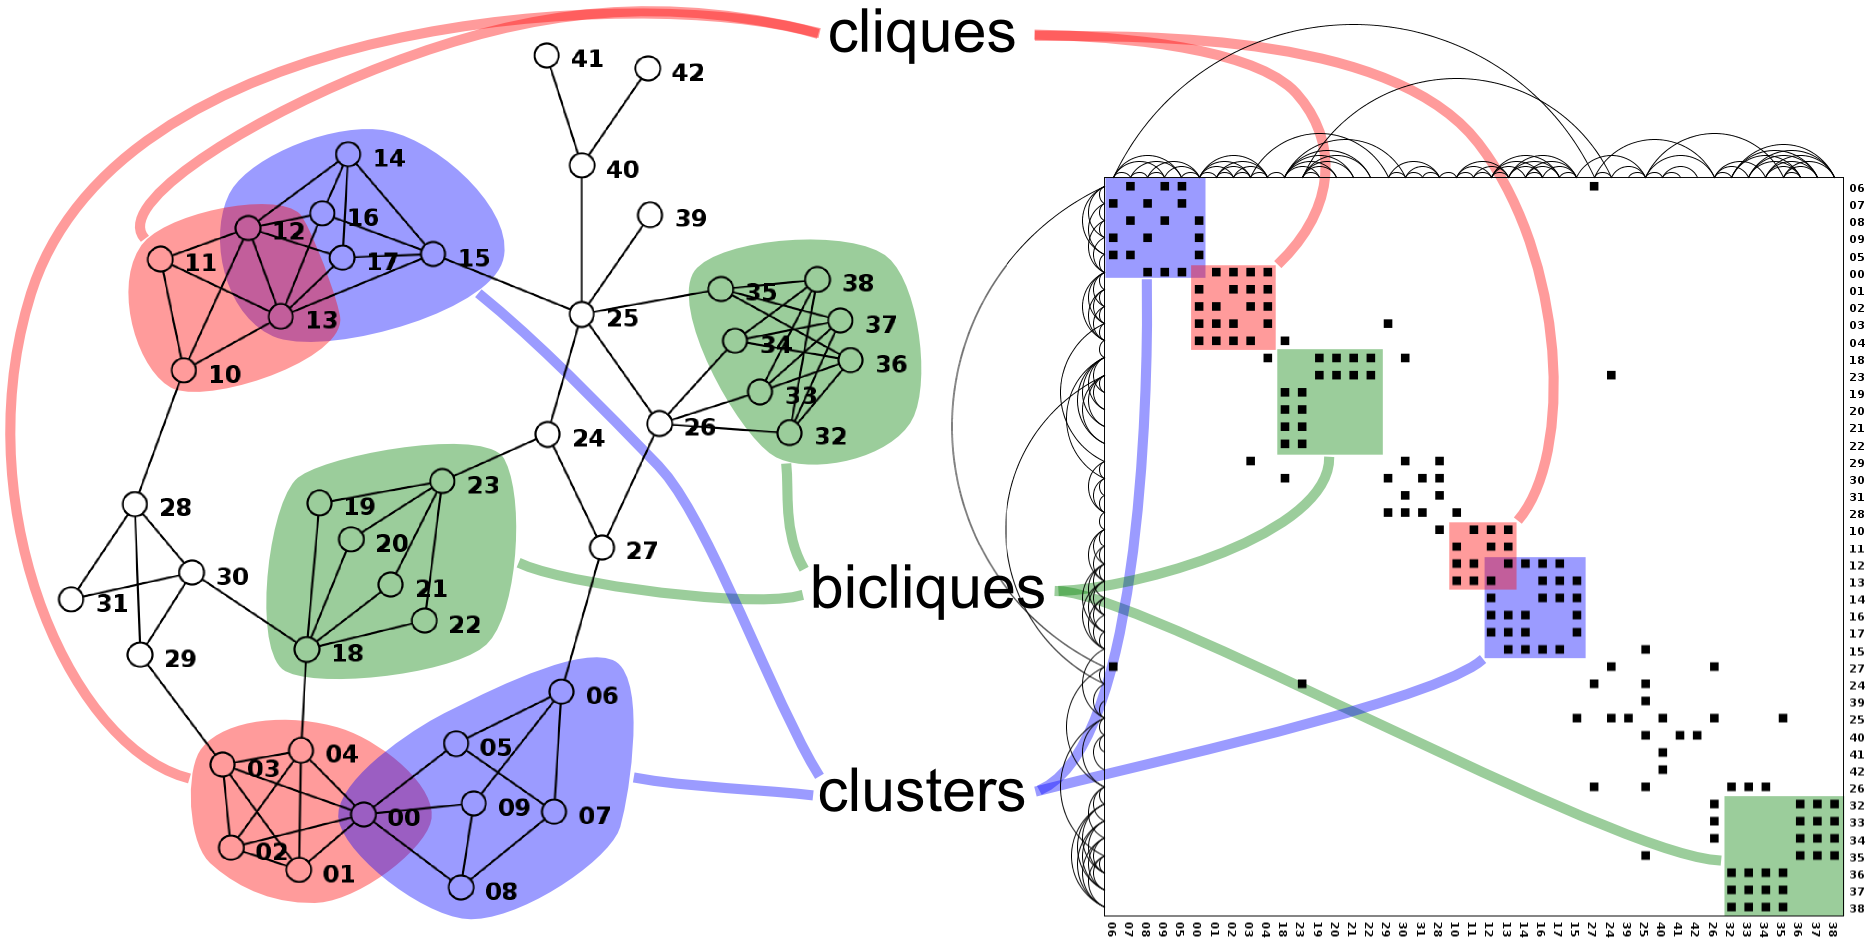
Connection vs. Adjacency Comparison
- Adjacency matrix strengths:
- Predictability, scalability, supports reordering
- Some topology tasks trainable
- Node-link diagram strengths:
- Topology understanding, path tracing
- Intuitive, no training needed
- Empirical study:
- Node-link best for small networks
- Matrix best for large networks...
- ...if tasks don’t involve topological structure!

Networks: Other Idioms
Chord Diagram
- Data: networks (small number of nodes)
- Tasks: summarize connections; identify highest degree
- Considerations: usually good for origin to destination

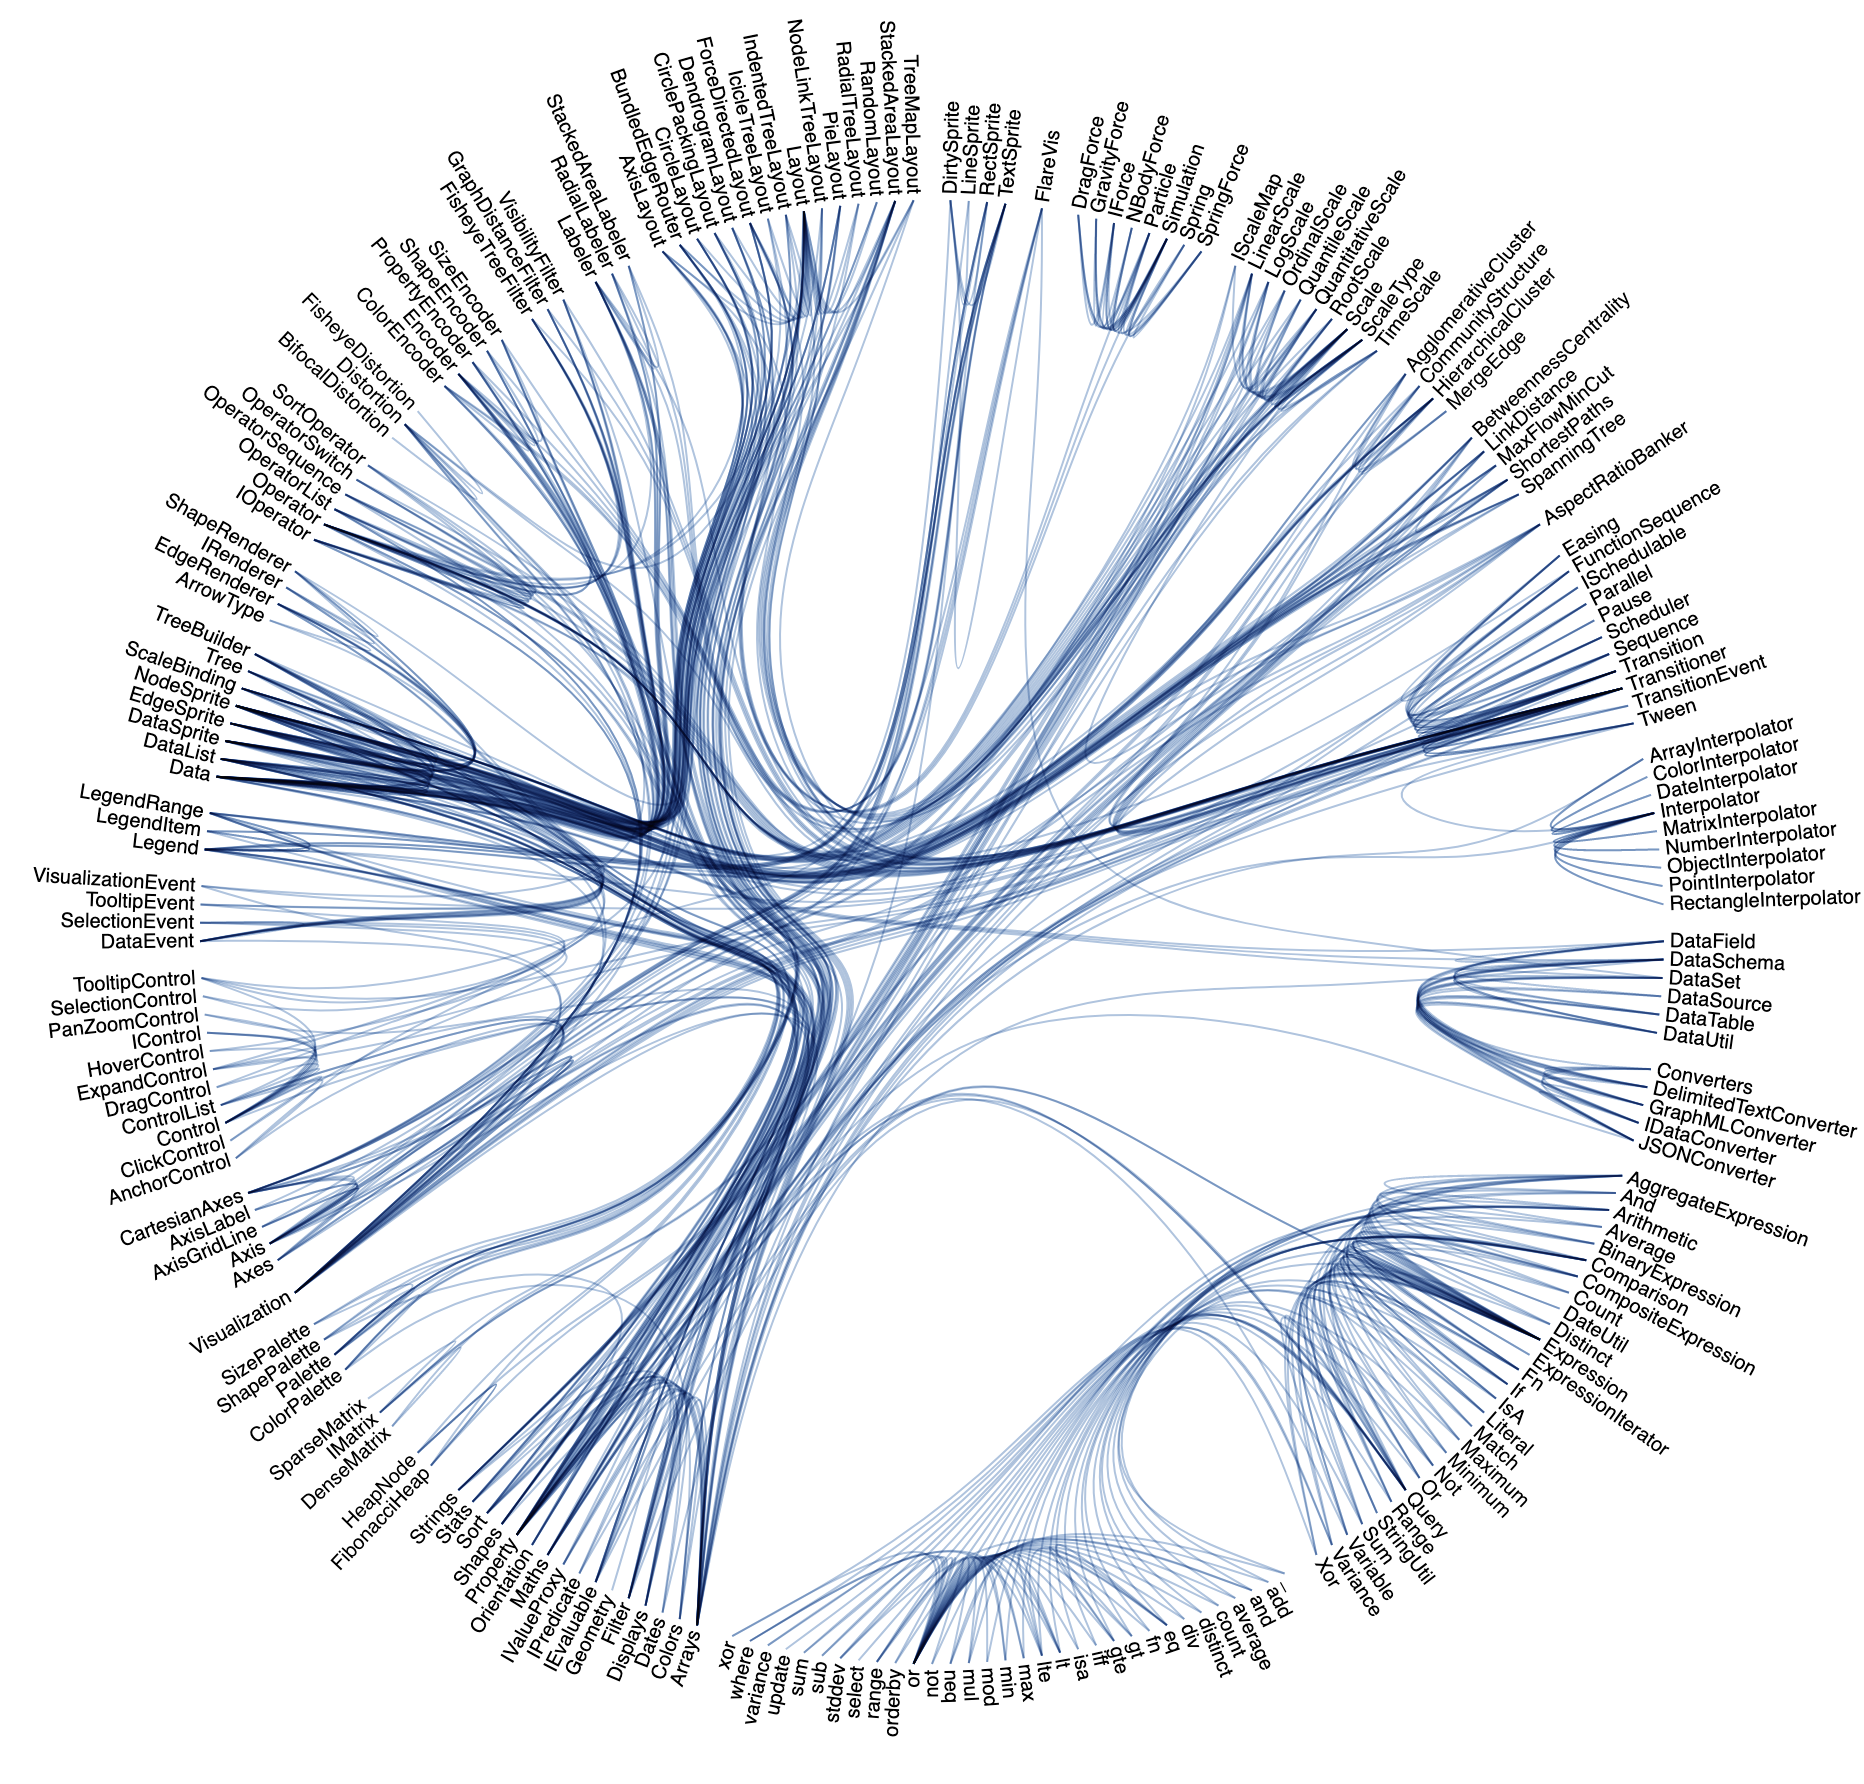
Edge Bundling
- Data: networks
- Tasks: summarize common connections
- Considerations:
- Reduces cluttering
- Requires computing time
- Works with any link based idiom
Arc Diagram
- Data: networks (few nodes)
- Tasks: summarize common connections.
- Considerations:
- Nodes' order matters.
- Better with highly clustered data

Hive Plots
Semantic Substrates
- Data: networks with many edges
- Task: summarize distribution of non network attribs
- Considerations:
- Easier to understand
- Scale well
- Edges on demand work best

Idiom: Sankey Diagram
- Good for depicting flow
- Not that well-known
Idiom: Parallel Sets
Metrics and Statistics
Simple Stuff
- Number of nodes, number of edges
- Connected components: count of separate groups of nodes
- Graph density: percent of possible links that are present

Degree Distribution
- E.g., run “Average Degree” tab in Gephi
- For pure random networks: $P_k = e ^ { \langle k \rangle } \frac{ \langle k \rangle ^k}{k!}$
- For preferential attachment: $P_k ~\sim~ k ^ {-\gamma}$

Path Length
- E.g., run “Average Path Length” in Gephi
- The path length between nodes i and j defined as $d_{ij}$
- Average path length $\langle d_{ij} \rangle$
- Network diameter $d_\max = \max _{i,j} d_{ij}$

Centrality
- Betweenness centrality: number of shortest paths across node
- Degree centrality (node degree), also edge centrality (not in Gephi, use NetworkX)
- Eigenvector centrality $Ax = \lambda x$
- Closeness $d_{cl} = \left [ \sum _{ij} d_{ij} ^ {-1} / n \choose 2 \right ] ^ {-1}$

More Centrality
- PageRank, like eigenvector centrality, can be written as an eigenvalue problem: $$PR(p_i) = \frac{1-d}{N} + \sum _{p_j} \frac{PR(p_j)}{L(p_j)}$$
Clustering
- Watts and Strogatz measure: $$ C_1 = \left \langle \frac{\sum_{j_1,j_2\in N} a_{j_1j_2}}{k_i(k_i-1)/2} \right \rangle $$
- Newman (and Gephi): $$ C_2 = \frac{3 \times \textrm{triangles}}{\textrm{triples}} $$

Modularity and Structure

Tools
Tools That Contain Layout Algorithms
Combining Layouts and Visualization
Many possibilities: Connect any tools that can compute layouts to any other visualation tool. A few useful examples:
- d3 + Vega-Lite (we've seen many d3!)
- NetworkX + Matplotlib (built-in)
NetworkX, Part I
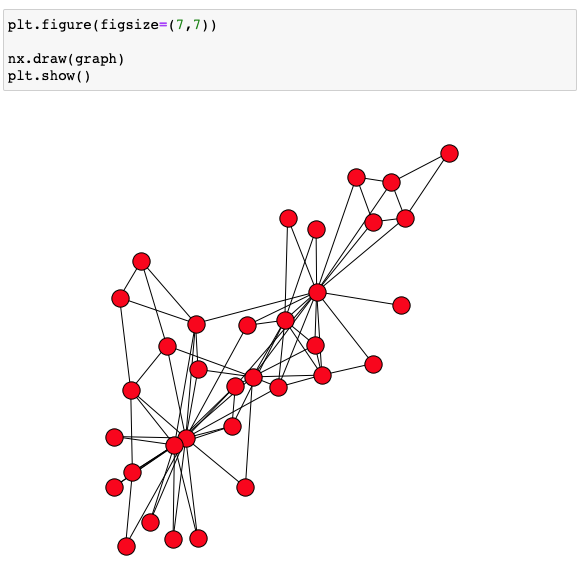
NetworkX, Part II

NetworkX, Part III
Color
Encode, Map, Color
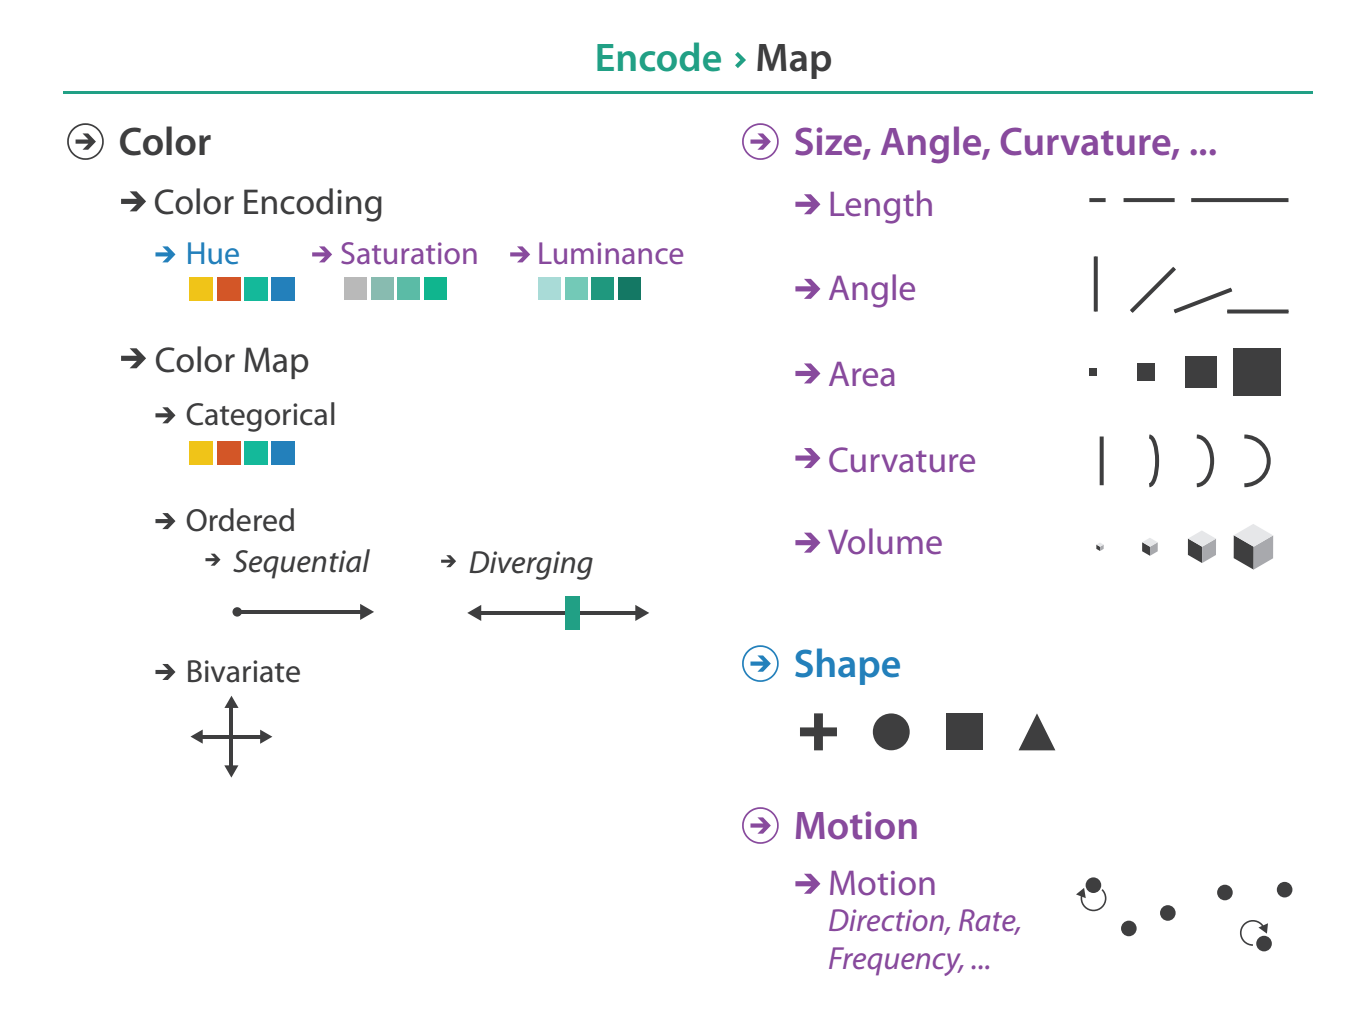
Categorical Color

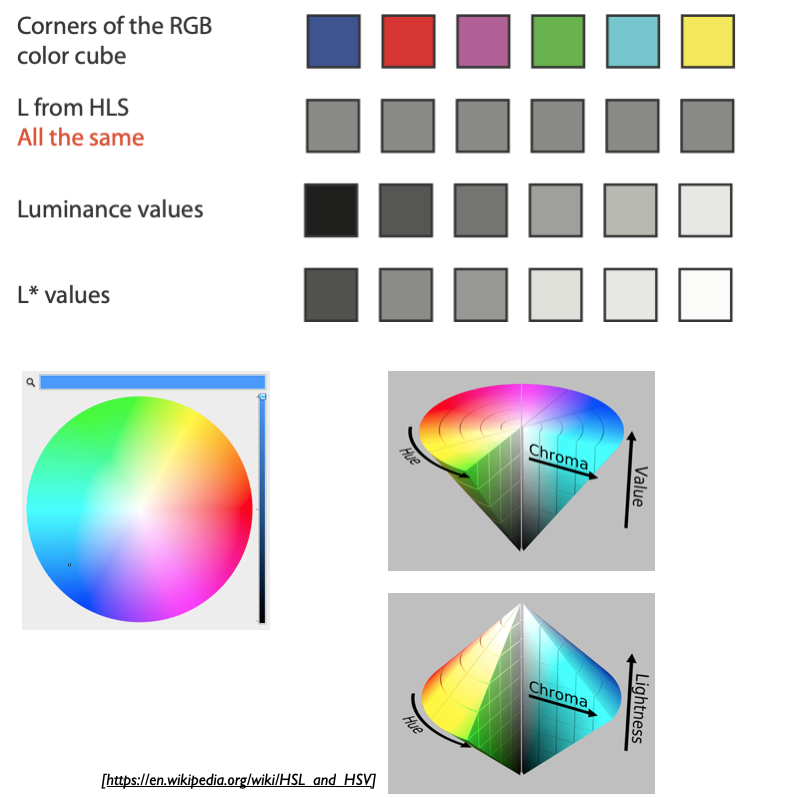
Decomposing Color
- First rule: do not talk about color!
- Color is confusing if treated as monolithic
- Decompose into three channels
- Ordered can show magnitude
- Luminance: how bright
- Saturation: how colorful
- Categorical can show identity
- Hue: what color
- Channels have different properties
- What they convey directly to perceptual system
- How much they can convey: how many discriminable bins can we use?

Spectral Sensitivity

Luminance
- Need luminance for edge detection
- Fine-grained detail only visible through luminance contrast
- Legible text requires luminance contrast!
- Intrinsic perceptual ordering

Color Spaces
Designing for Color Deficiency: Check with Simulator

Designing for Color Deficiency: Avoid Encoding by Hue Alone
- Redundantly encode.
- Vary luminance.
- Change shape.

Color Deficiency: Reduces Color to Two Dimensions

Designing for Color Deficiency: Blue-Orange is Safe

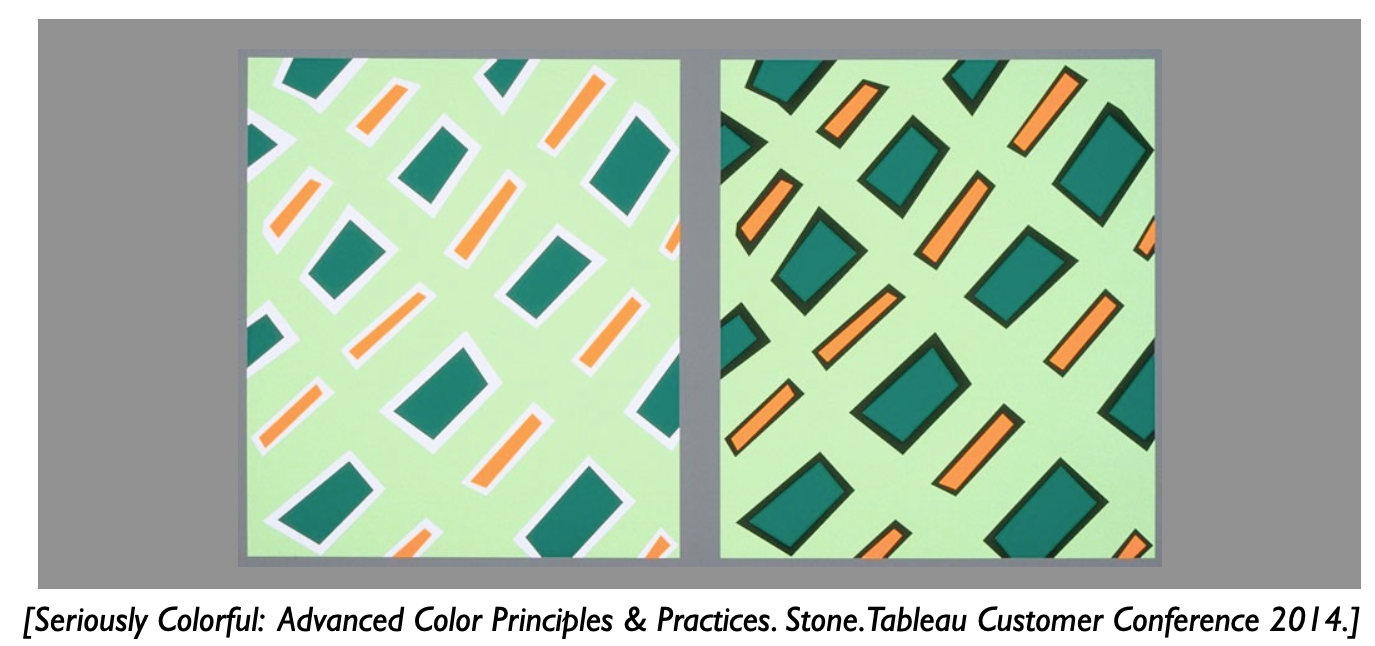
Bezold Effect: Outlines Matter
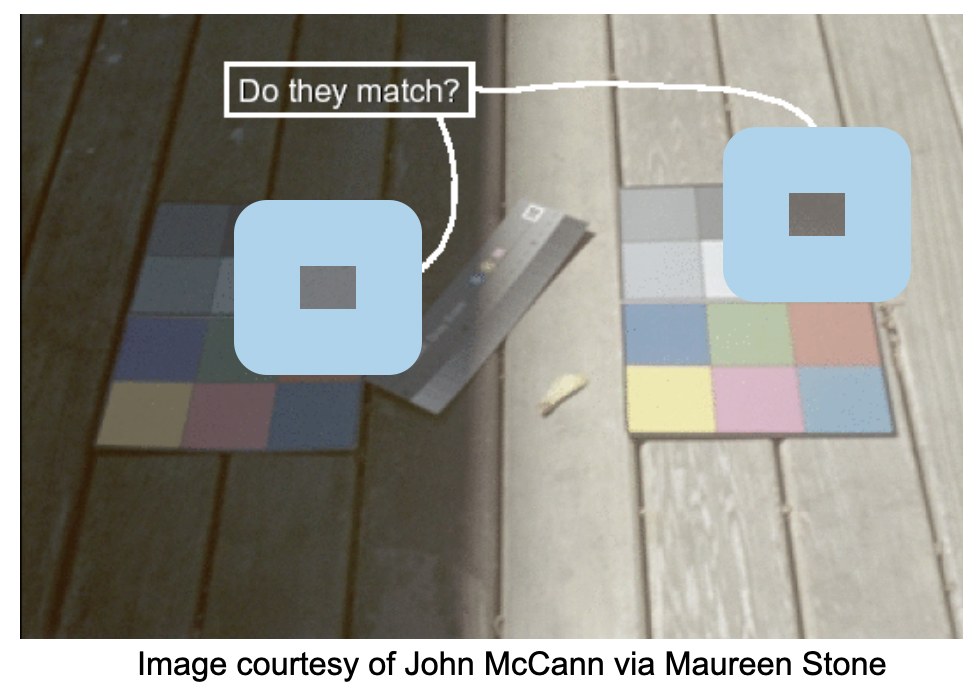
Relative Judgments: Color and Illumination

Relative Judgments: Color and Illumination (cont.)
Categorical Color: Limited Number of Discriminable Bins
- Human perception built on relative comparisons
- Great if color is contiguous
- Suprisingly bad for absolute comparisons
- Noncontiguous small regions of color
- Fewer bins than you want
- Rule of thumb: 6-12 bins, including background and highlights

Glyphs
- Glyphs: composite objects
- Internal structure with multiple marks
- Alternative to color encoding
- Or coding with any single channel

ColorBrewer

Ordered Color
Ordered Color: Rainbow is Poor Default
- Problems:
- Perceptually unordered
- Perceptually nonlinear
- Benefits:
- Fine-grained structure visible and nameable
- Alternative:
- Large-scale structure: fewer hues
- Fine structure: multiple hues with monotonically increasing luminance (vs. Viridis R/Python)

Viridis
Colorful, perceptually uniform, colorblind-safe, monotonically-increasing luminance

Colormaps


Map Other Channels
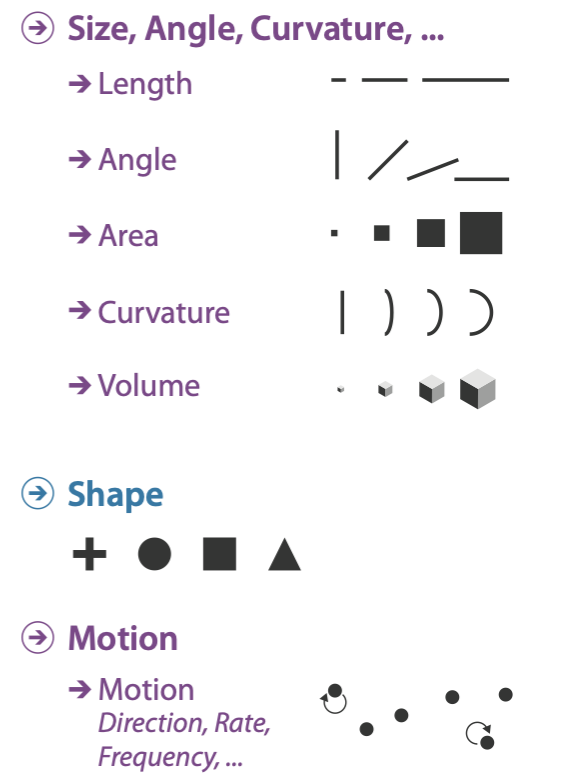
Angle

What We Learned
- How to recognize, create, and store networks
- Algorithms to visualize network data
- How to use color