Reducing Attributes and Rows
MIDS W209: Information Visualization
Andy Reagan | andy[at]andyreagan.com |@andyreagan
https://johnguerra.co/lectures/MIDS_W209_Information_Visualization/06_Tabular/

What We Are Going to Learn
- Reduce
- Items
- Attributes
- Aggregation
- Item
- Spatial
- Time
- Dimensionality Reduction
- Embed, Focus and Context
- Exploratory Data Analysis
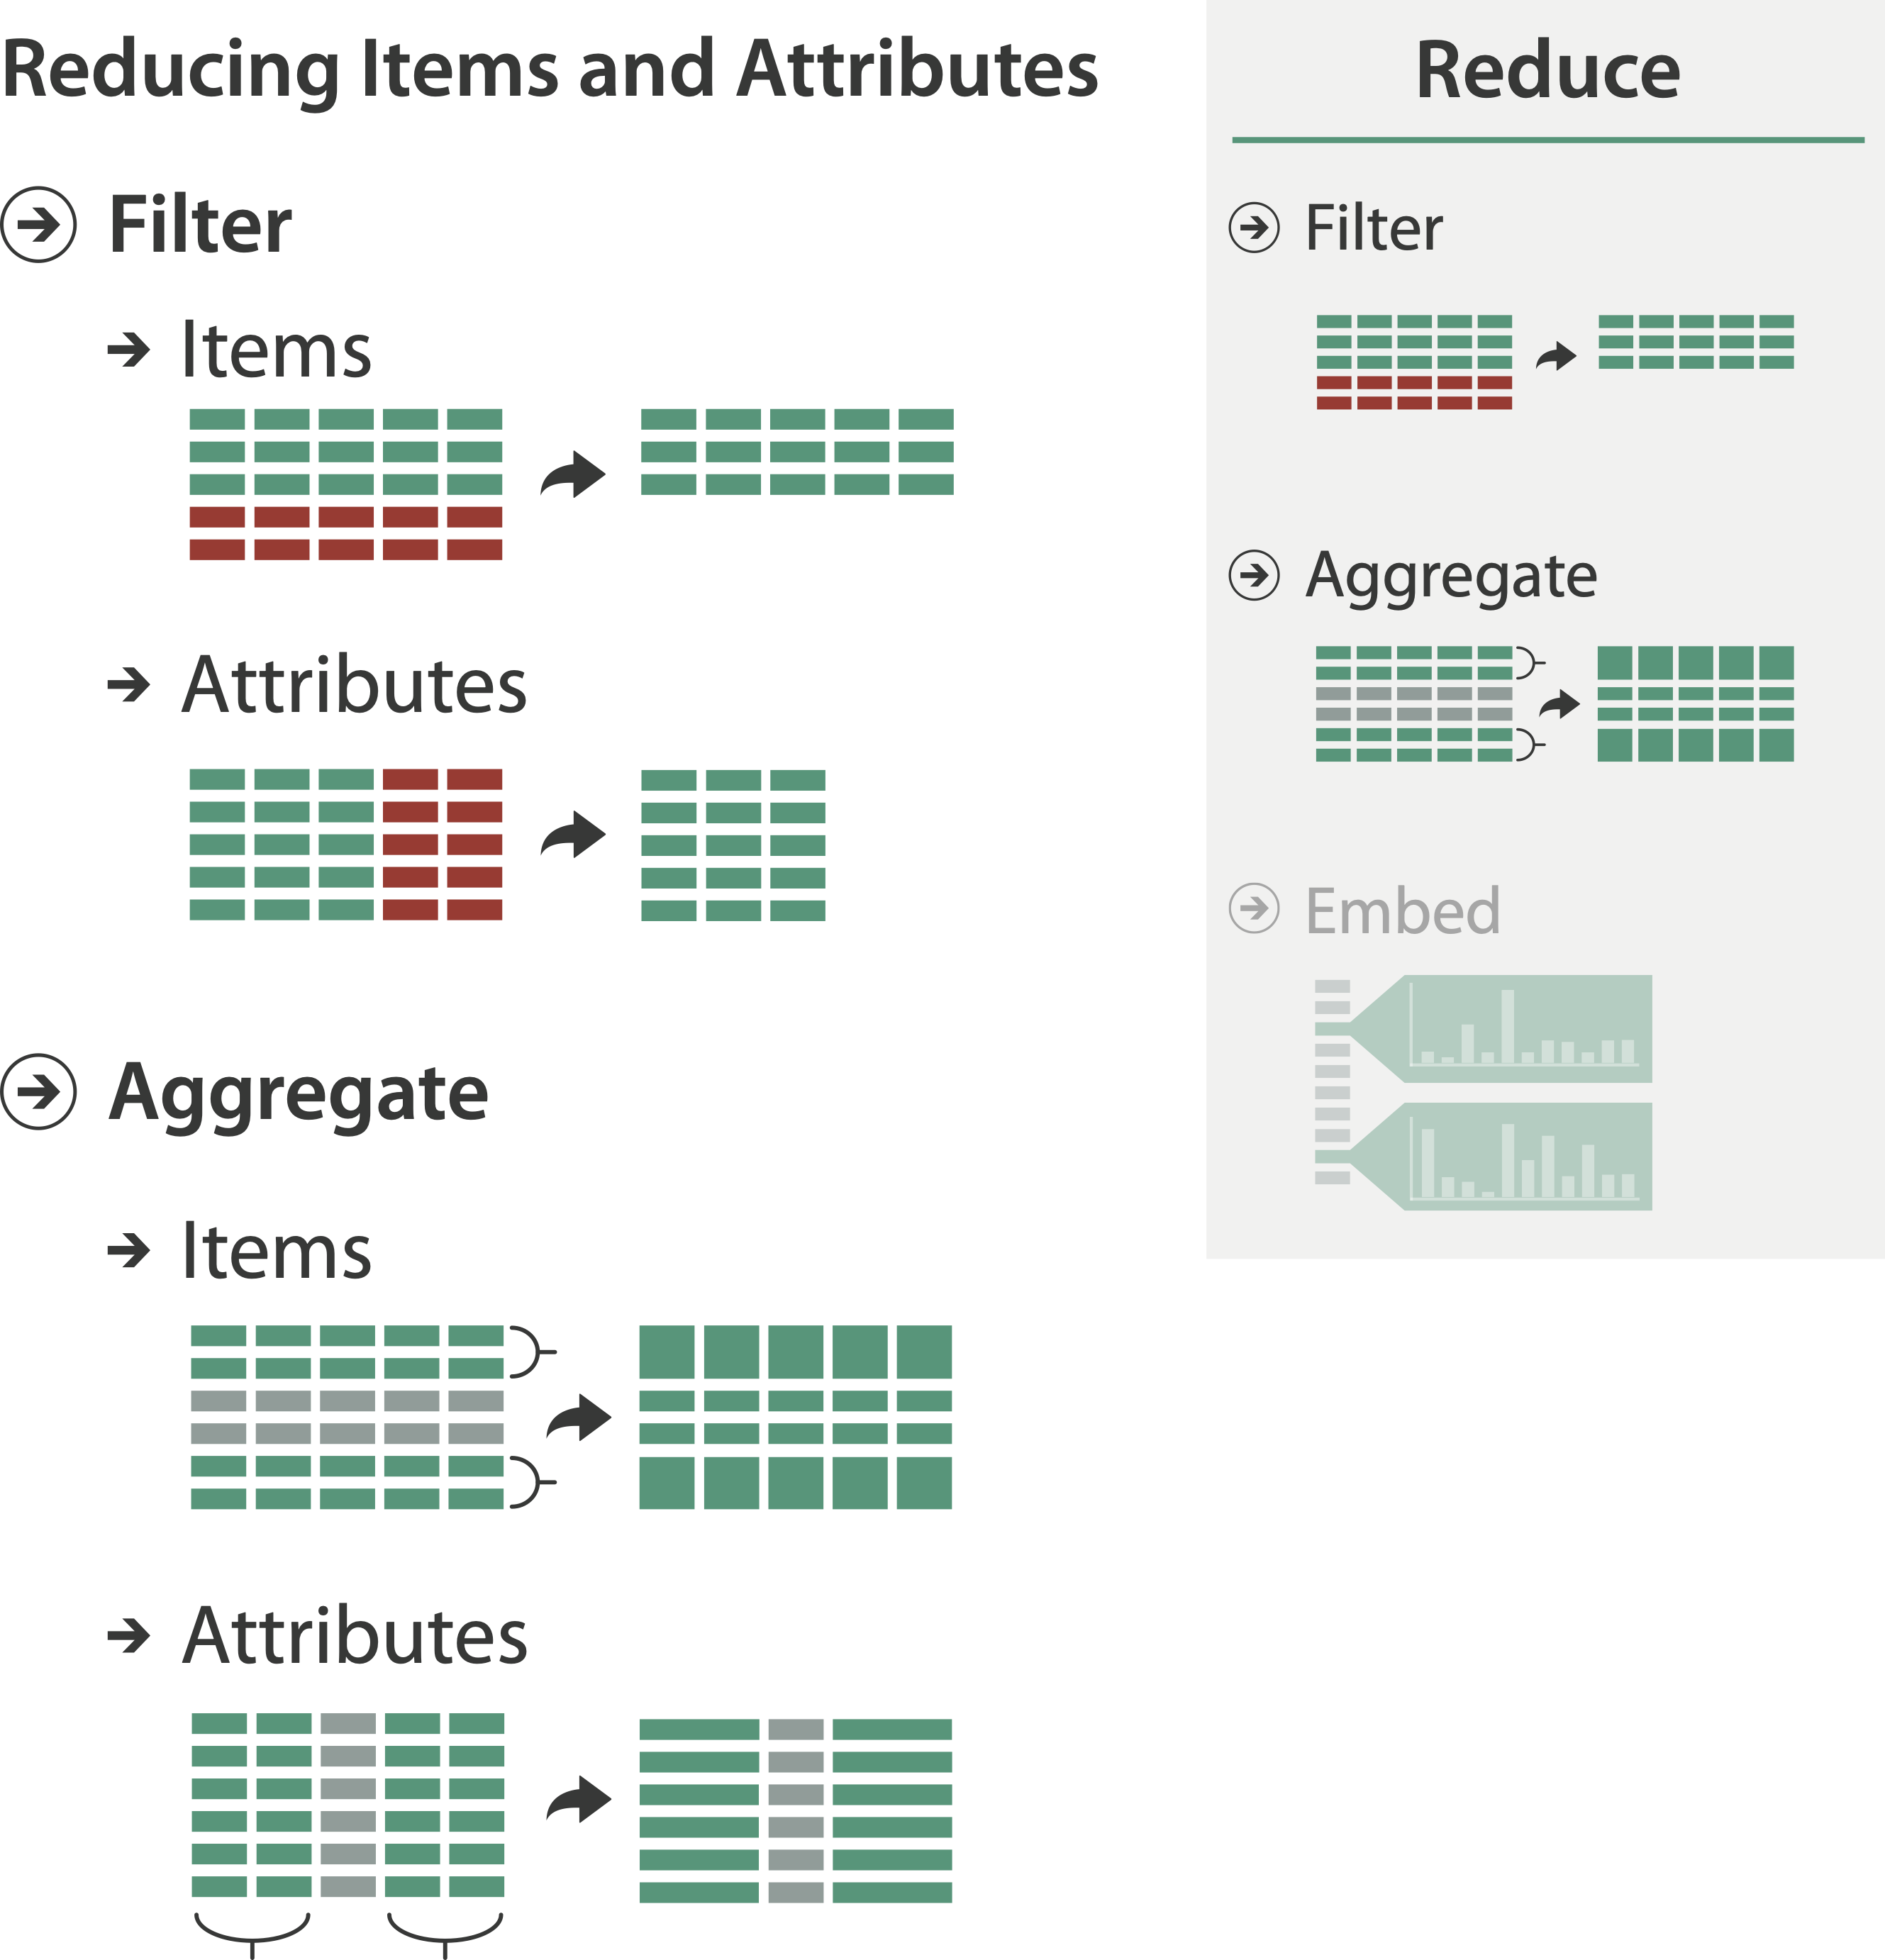
Reduce Items and Attributes
Reduce Items and Attributes
- Reduce/increase: inverses
- Filter
- Pro: straightforward and intuitive
- To understand and compute
- Con: out of sight, out of mind
- Pro: straightforward and intuitive
- Aggregation
- Pro: inform about whole set
- Con: difficult to avoid losing signal
- Not mutually exclusive
- Combine filter, aggregate
- Combine reduce, change, facet
Item Filtering
Crossfiltering
- Item filtering
- Coordinated views/controls combined
- All scented histogram bisliders update when any ranges change
Faceted Search
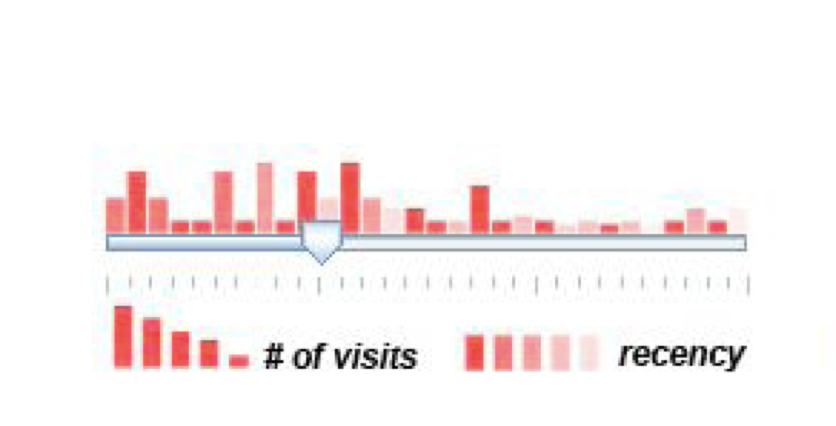
Idiom: Scented Widgets
- Augmented widgets show information scent
- Cues to show whether value in drilling down further vs. looking elsewhere
- Concise use of space: histogram on slider

Scented Widgets Paper
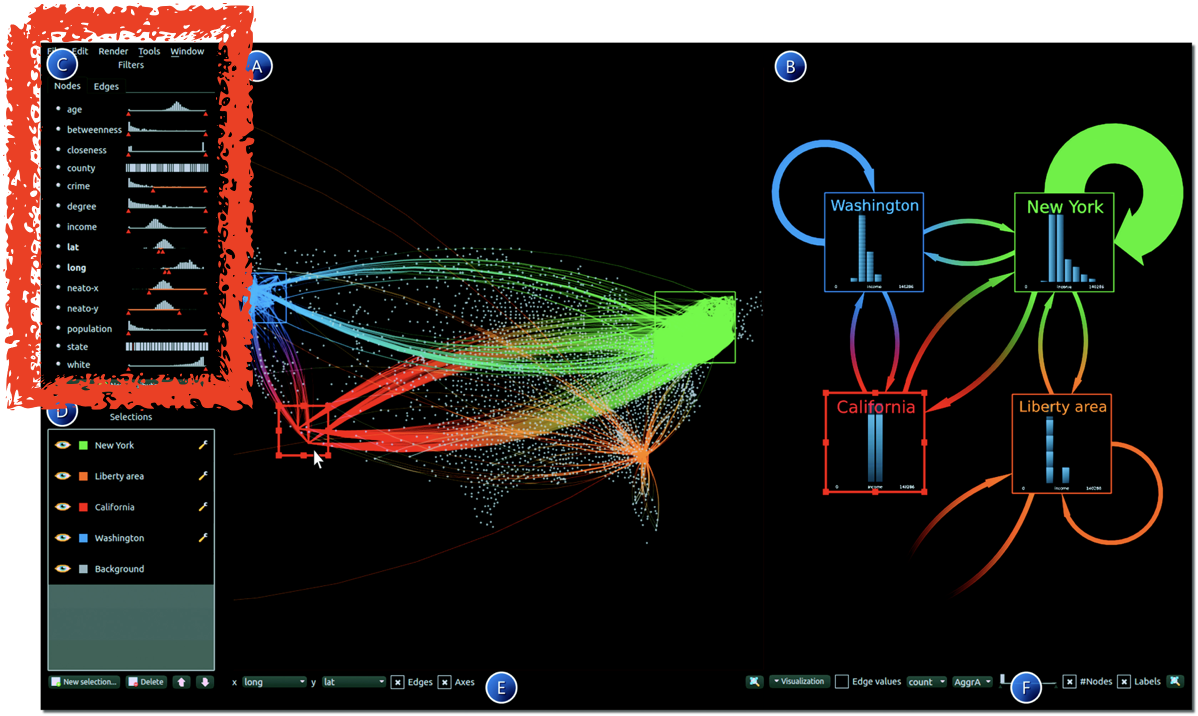
Navio

Attribute Filtering
DOSFA Paper
http://www.cs.ubc.ca/~tmm/courses/cpsc533c-04-spr/readings/dimorder.pdfNavio Load Notebook
UMAP Playground
Dimensionality Reduction
Aggregation: Hierarchichal Cluster Explorer
Item Aggregation
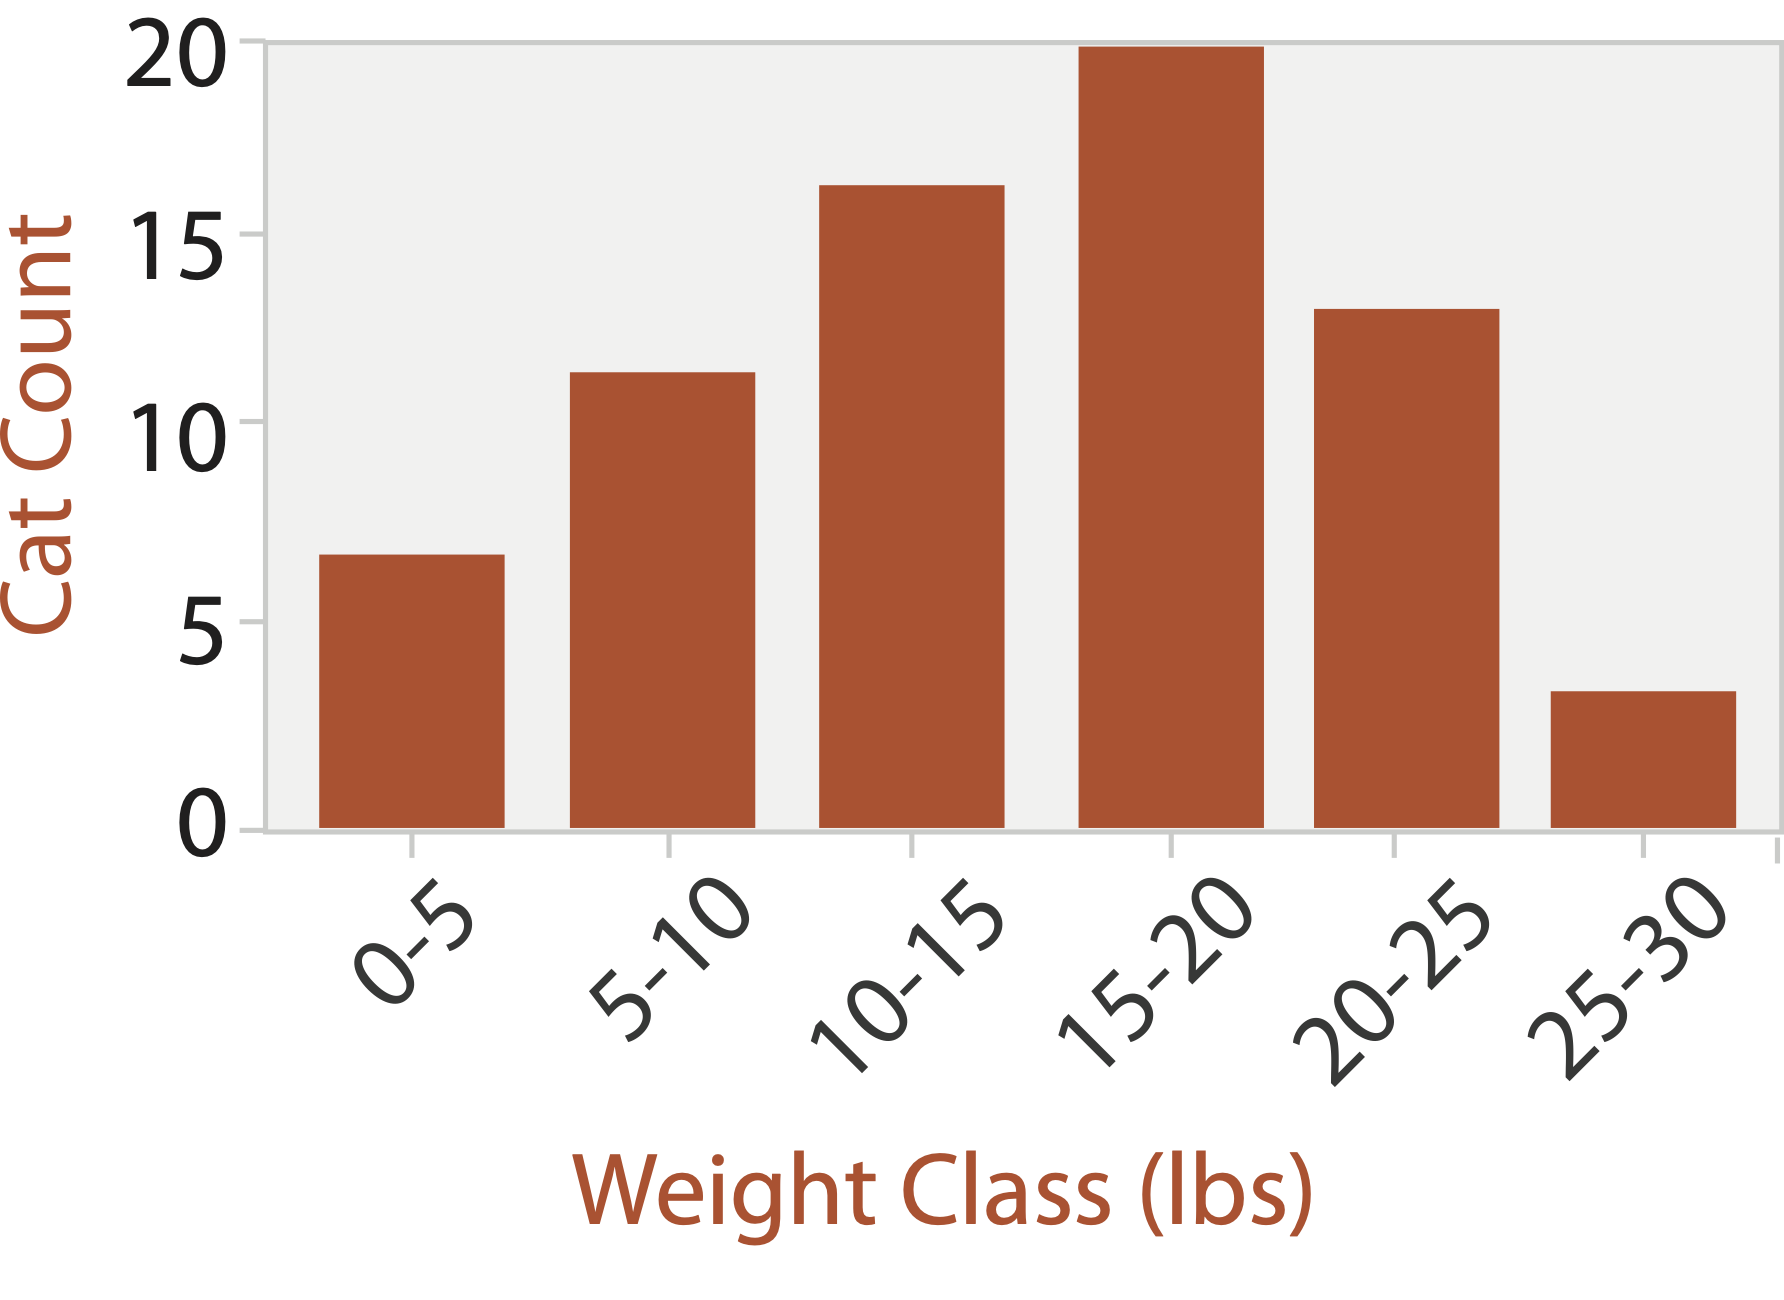
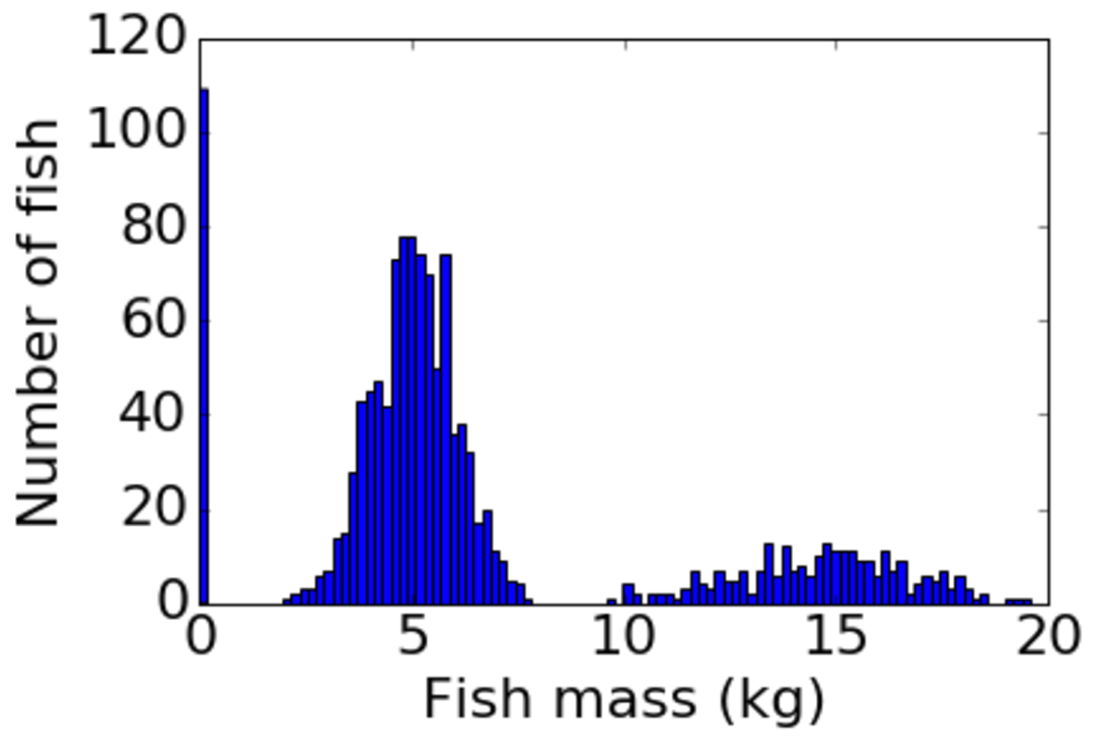
Idiom: Histogram
- Static item aggregation
- Task: find distribution
- Data: table
- Derived data
- New table: keys are bins, values are counts
- Bin size crucial
- Pattern can change dramatically depending on discretization
- Opportunity for interaction: control bin size on the fly
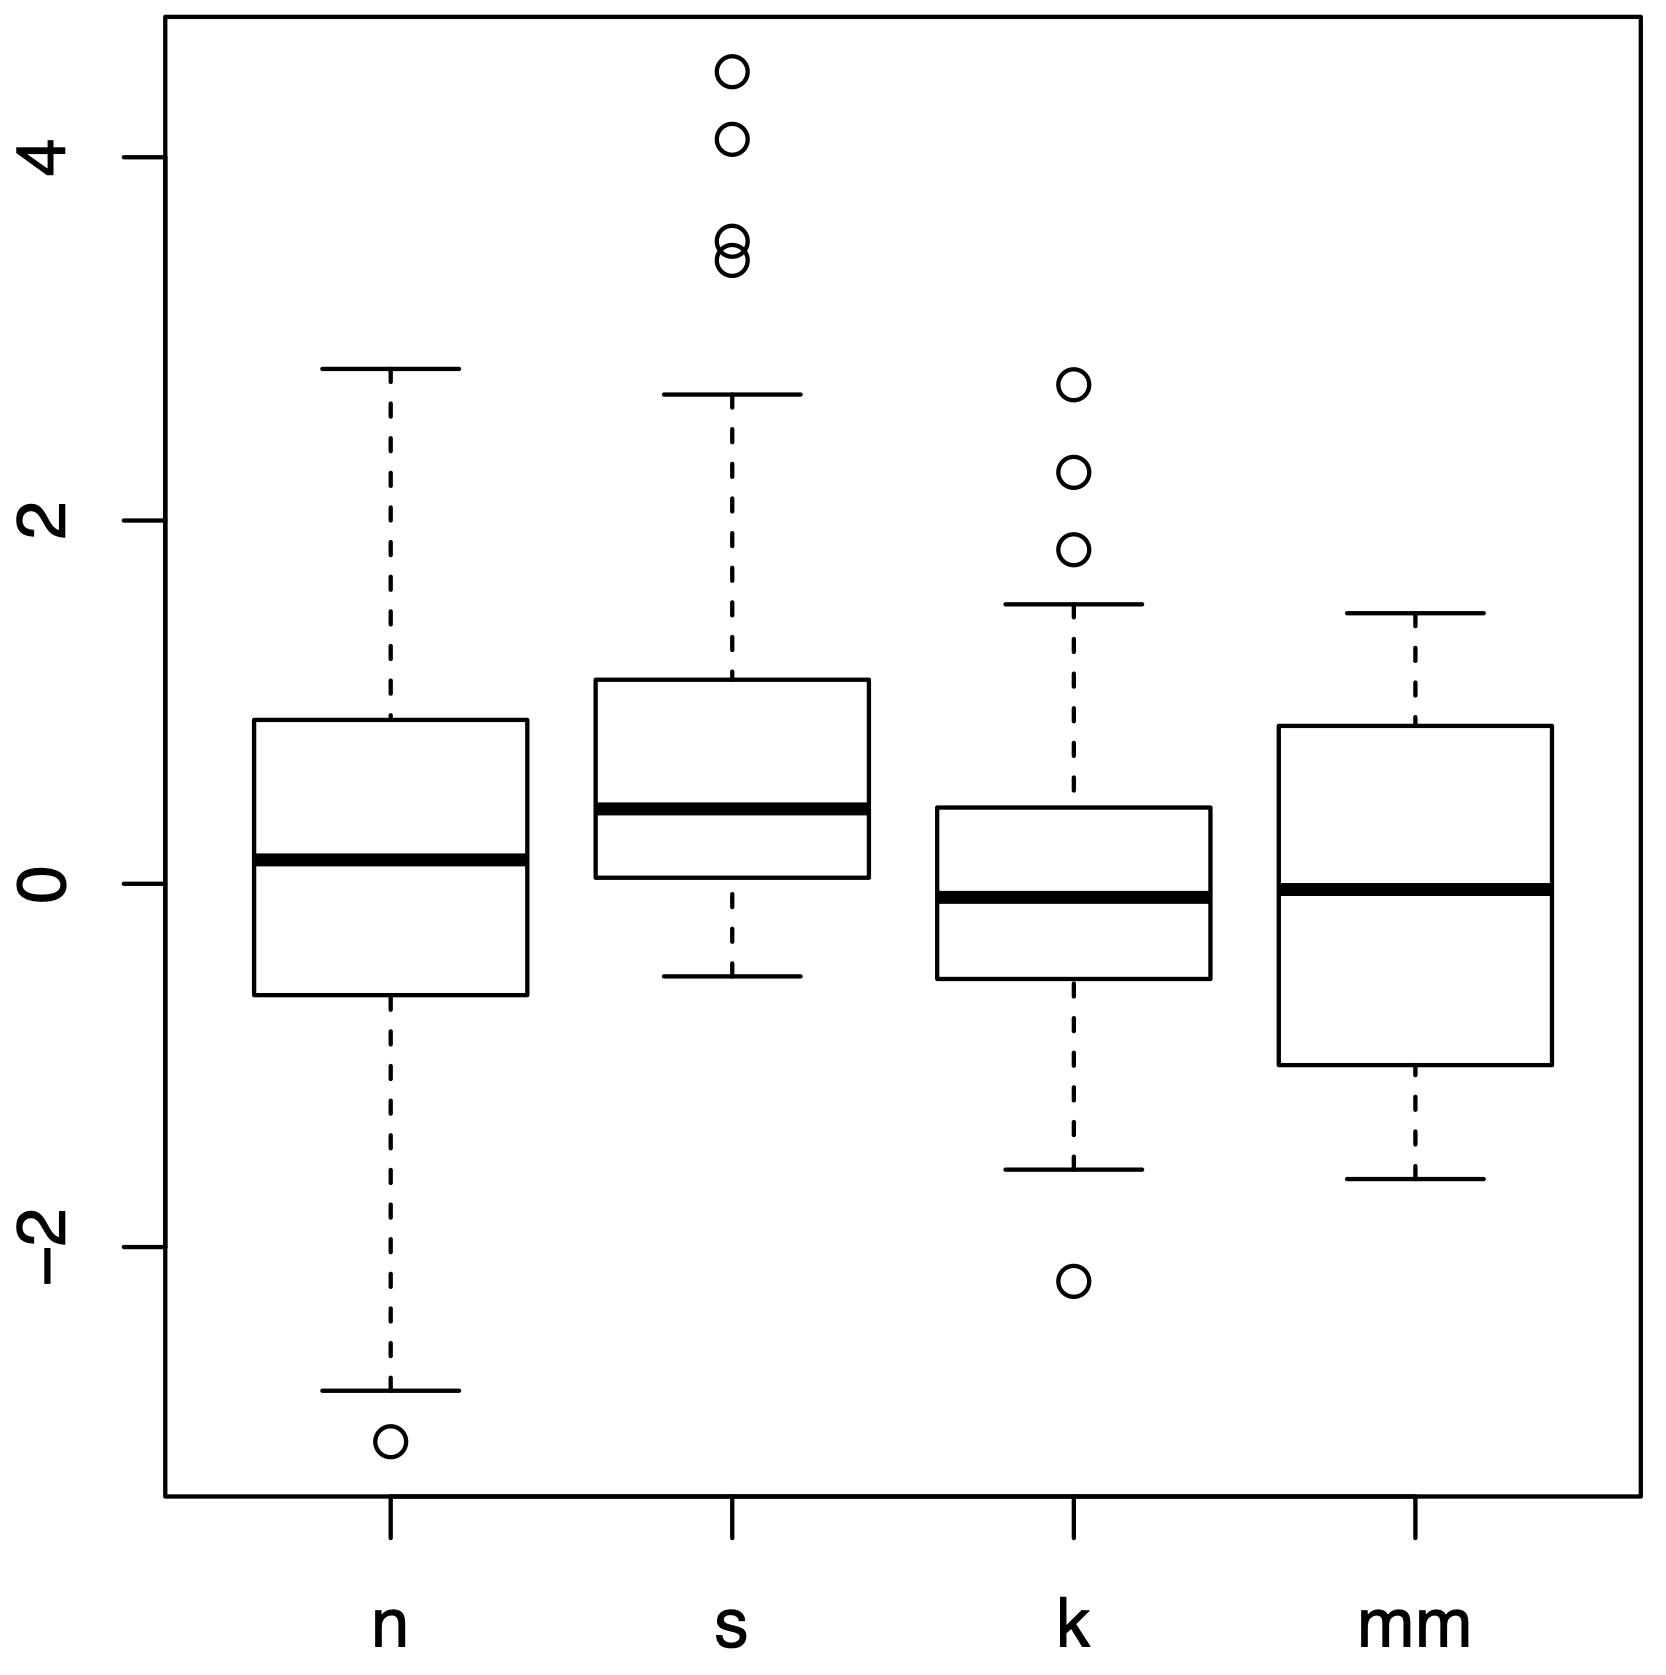
Idiom: Boxplot
- Static item aggregation
- Task: find distribution
- Data: table
- Derived data
- Five quantitative attributes
- Median: central line
- Lower and upper quartile: boxes
- Lower upper fences: whiskers
- Values beyond which items are outliers
- Outliers beyond fence cutoffs explicitly shown
Box Plot
http://blockbuilder.org/mbostock/4061502by mbostockViolin Plot
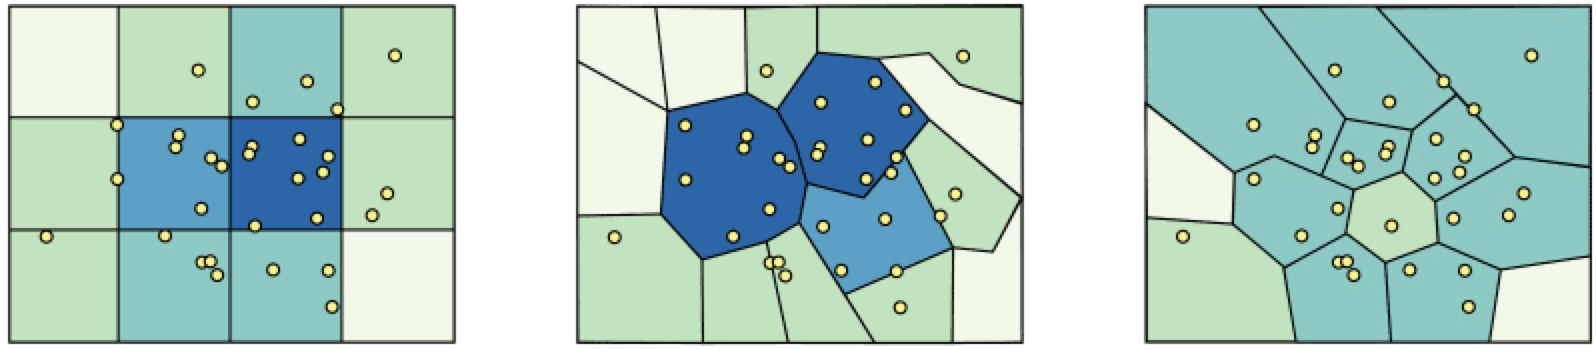
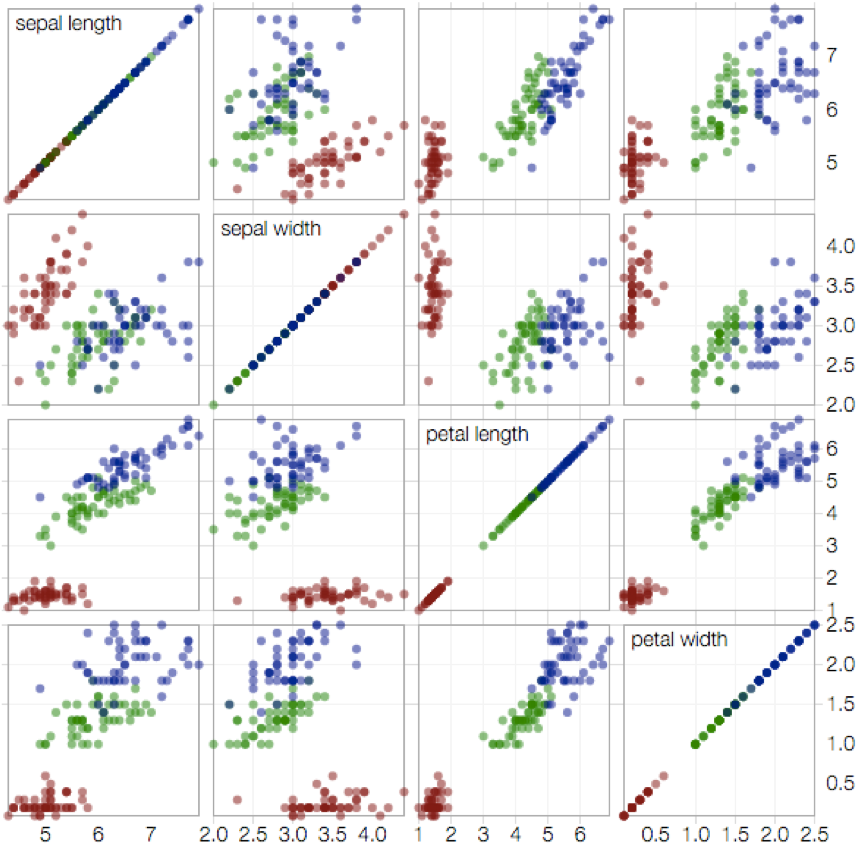
http://blockbuilder.org/asielen/92929960988a8935d907e39e60ea8417by asielenIdiom: 2D Density Plots
- Scatterplot meets heatmap
- Derived data:
- Tesselate space info areas
- Count number of elements falling on that area
- Mark: dots (boxes)
- Channels:
- Position: location of areas
- Color (brightness): number of elements
- Marks (re-)ordered by cluster hierarchy traversal
- Tasks: summarize distribution
- Scalability:
- Millions of rows (might require preprocessing)
Interactive Density Plot
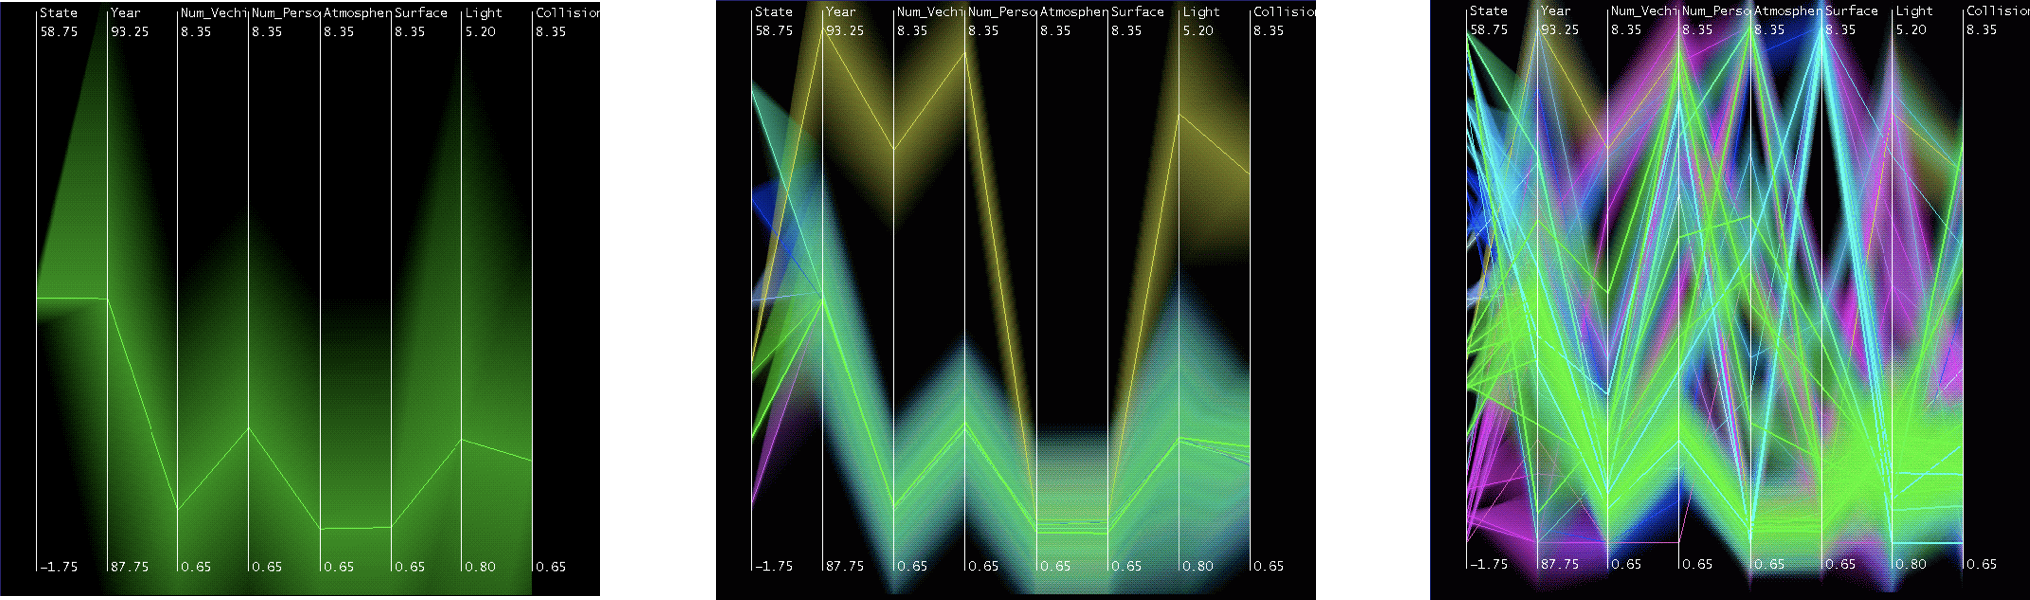
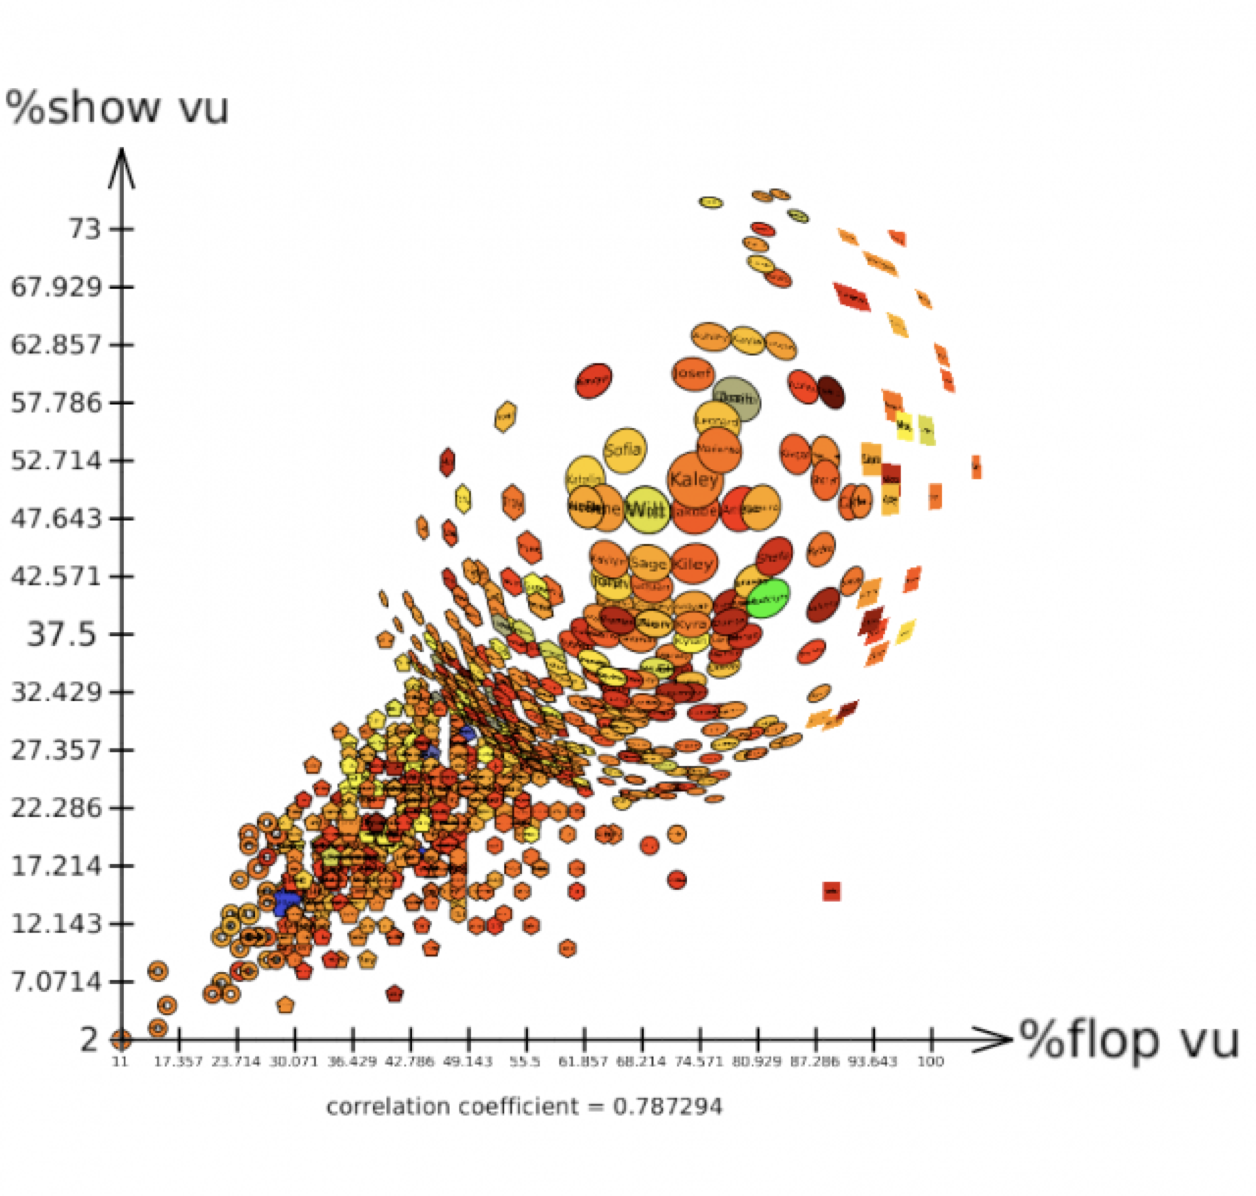
Idiom: Hierarchical Parallel Coordinates
- Dynamic item aggregation
- Derived data: hierarchical clustering
- Encoding:
- Cluster band with variable transparency, line at mean, width by min/max values
- Color by proximity in hierarchy
Spatial Aggregation
Geo Level
- Country
- State
- City
- Neighborhood
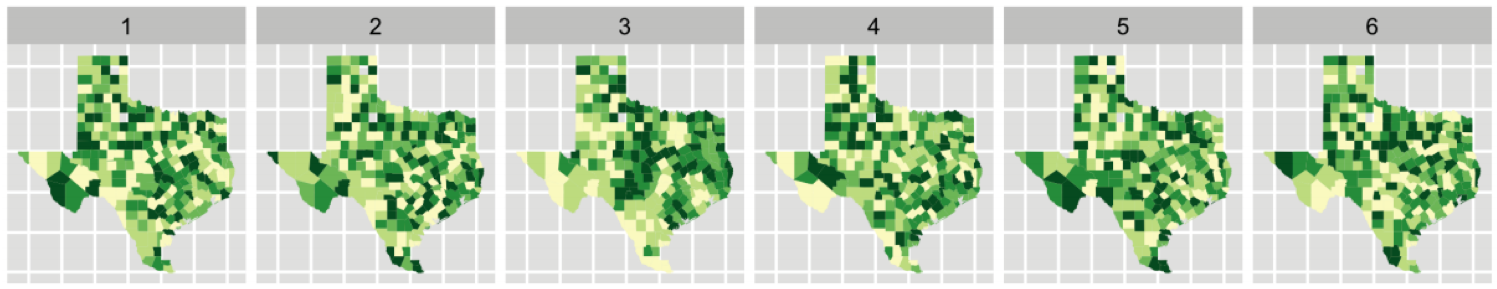
Aggregation Problems
- MAUP: Modifiable Areal Unit Problem
- Gerrymandering (manipulating voting district boundaries) is only one example!
- Zone effects
- Scale effects
Overlapping
- ZIP codes
- Disputed borders
Regions
- Aggregate by commonalities
- e.g. Agricultural vs. industrial regions
- e.g. Historically right- vs. left-wing
- Aggregate by the data attributes
Geo patterns vs. political patterns
- Risaralda example
Time Aggregation
Date Part vs. Truncate
- Date part: extract a part of the date
- Date truncate: cut the date at a certain level
Date Truncate
- Different levels can hide seasonality.
- Sometimes, too much detail is unnecessary.
Truncate dates
Date Part
- Useful for highlighting human patterns
- Weekends
- Night time
- Holidays
- Summer vs. winter
Aggregate by date parts
Window Average/Median
Dimensionality Reduction
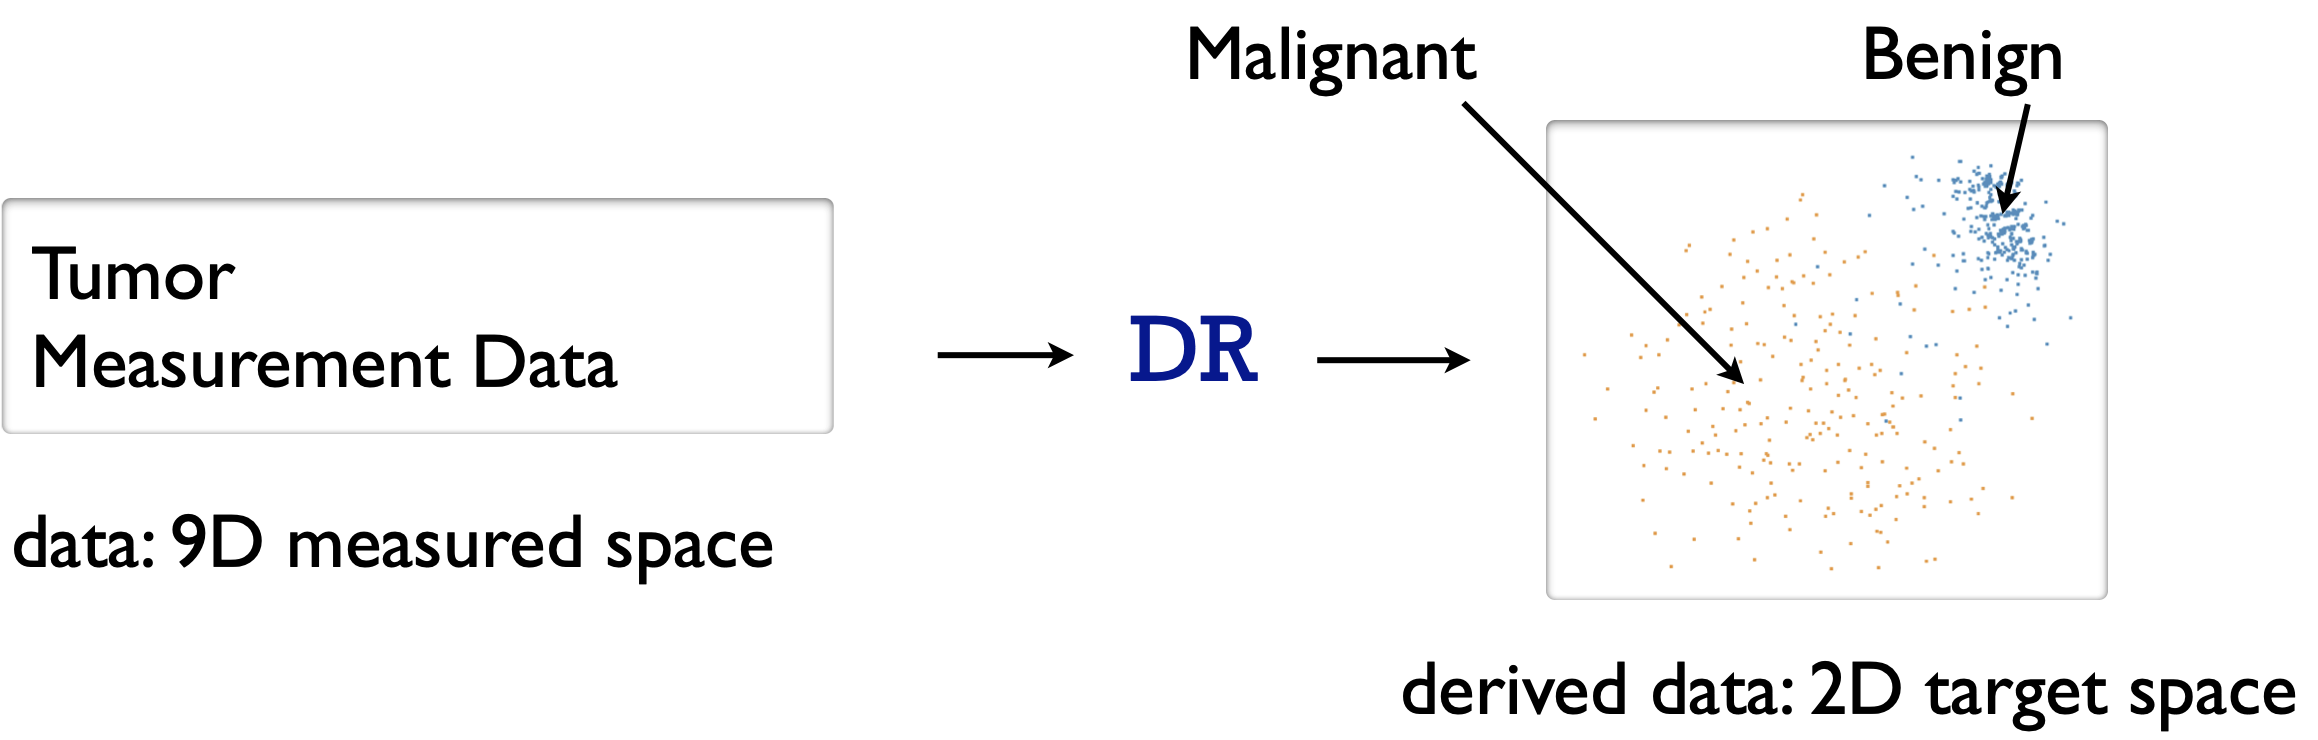
Dimensionality Reduction
- Attribute aggregation
- Derive low-dimensional target space from high-dimensional measured space
- Capture most of variance with minimal error
- Use when you can’t directly measure what you care about
- True dimensionality of dataset conjectured to be smaller than dimensionality of measurements
- Latent factors, hidden variables
Dimensionality Reduction for Documents
Dimensionality vs. Attribute Reduction
- Vocab use in field not consistent
- Dimension/attribute
- Attribute reduction: reduce set with filtering
- Includes orthographic projection
- Dimensionality reduction (DR): create smaller set of new dimensionss/attributes
- Typically implies dimensional aggregation, not just filtering
- Vocabulary: projection/mapping
Estimating True Dimensionality
- How do you know when you would benefit from DR?
- Consider error for low-dim projection vs. high-dim projection
- No single correct answer; many metrics proposed
- Cumulative variance that is not accounted for
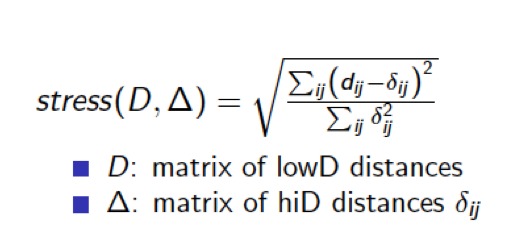
- Strain: match variations in distance (vs. actual distance values)
- Stress: difference between interpoint distances in high and low dimensionss
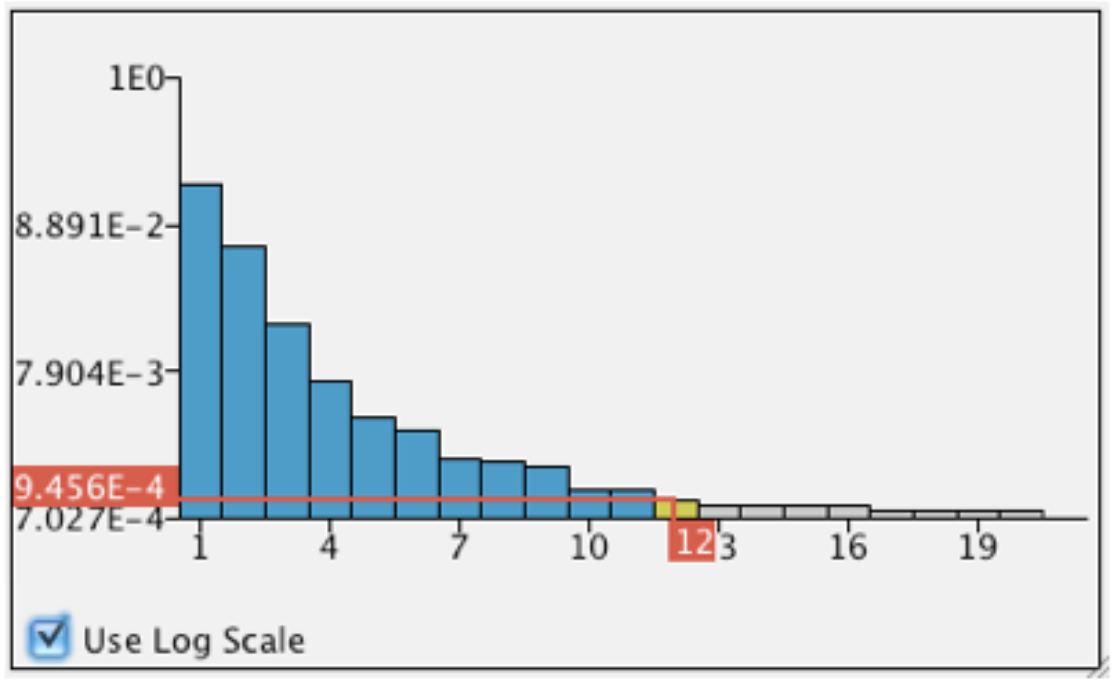
Estimating True Dimensionality
- Scree plots as simple way: error against number of attributes
- Original dataset: 294 dimensions
- Estimate: Almost all variance preserved with less than 20 dimensions
Dimensionality Reduction and Visualization
- Why do people do DR?
- Improve performance of downstream algorithm
- Avoid curse of dimensionality
- Data analysis
- If looking at the output: visual data analysis
- Improve performance of downstream algorithm
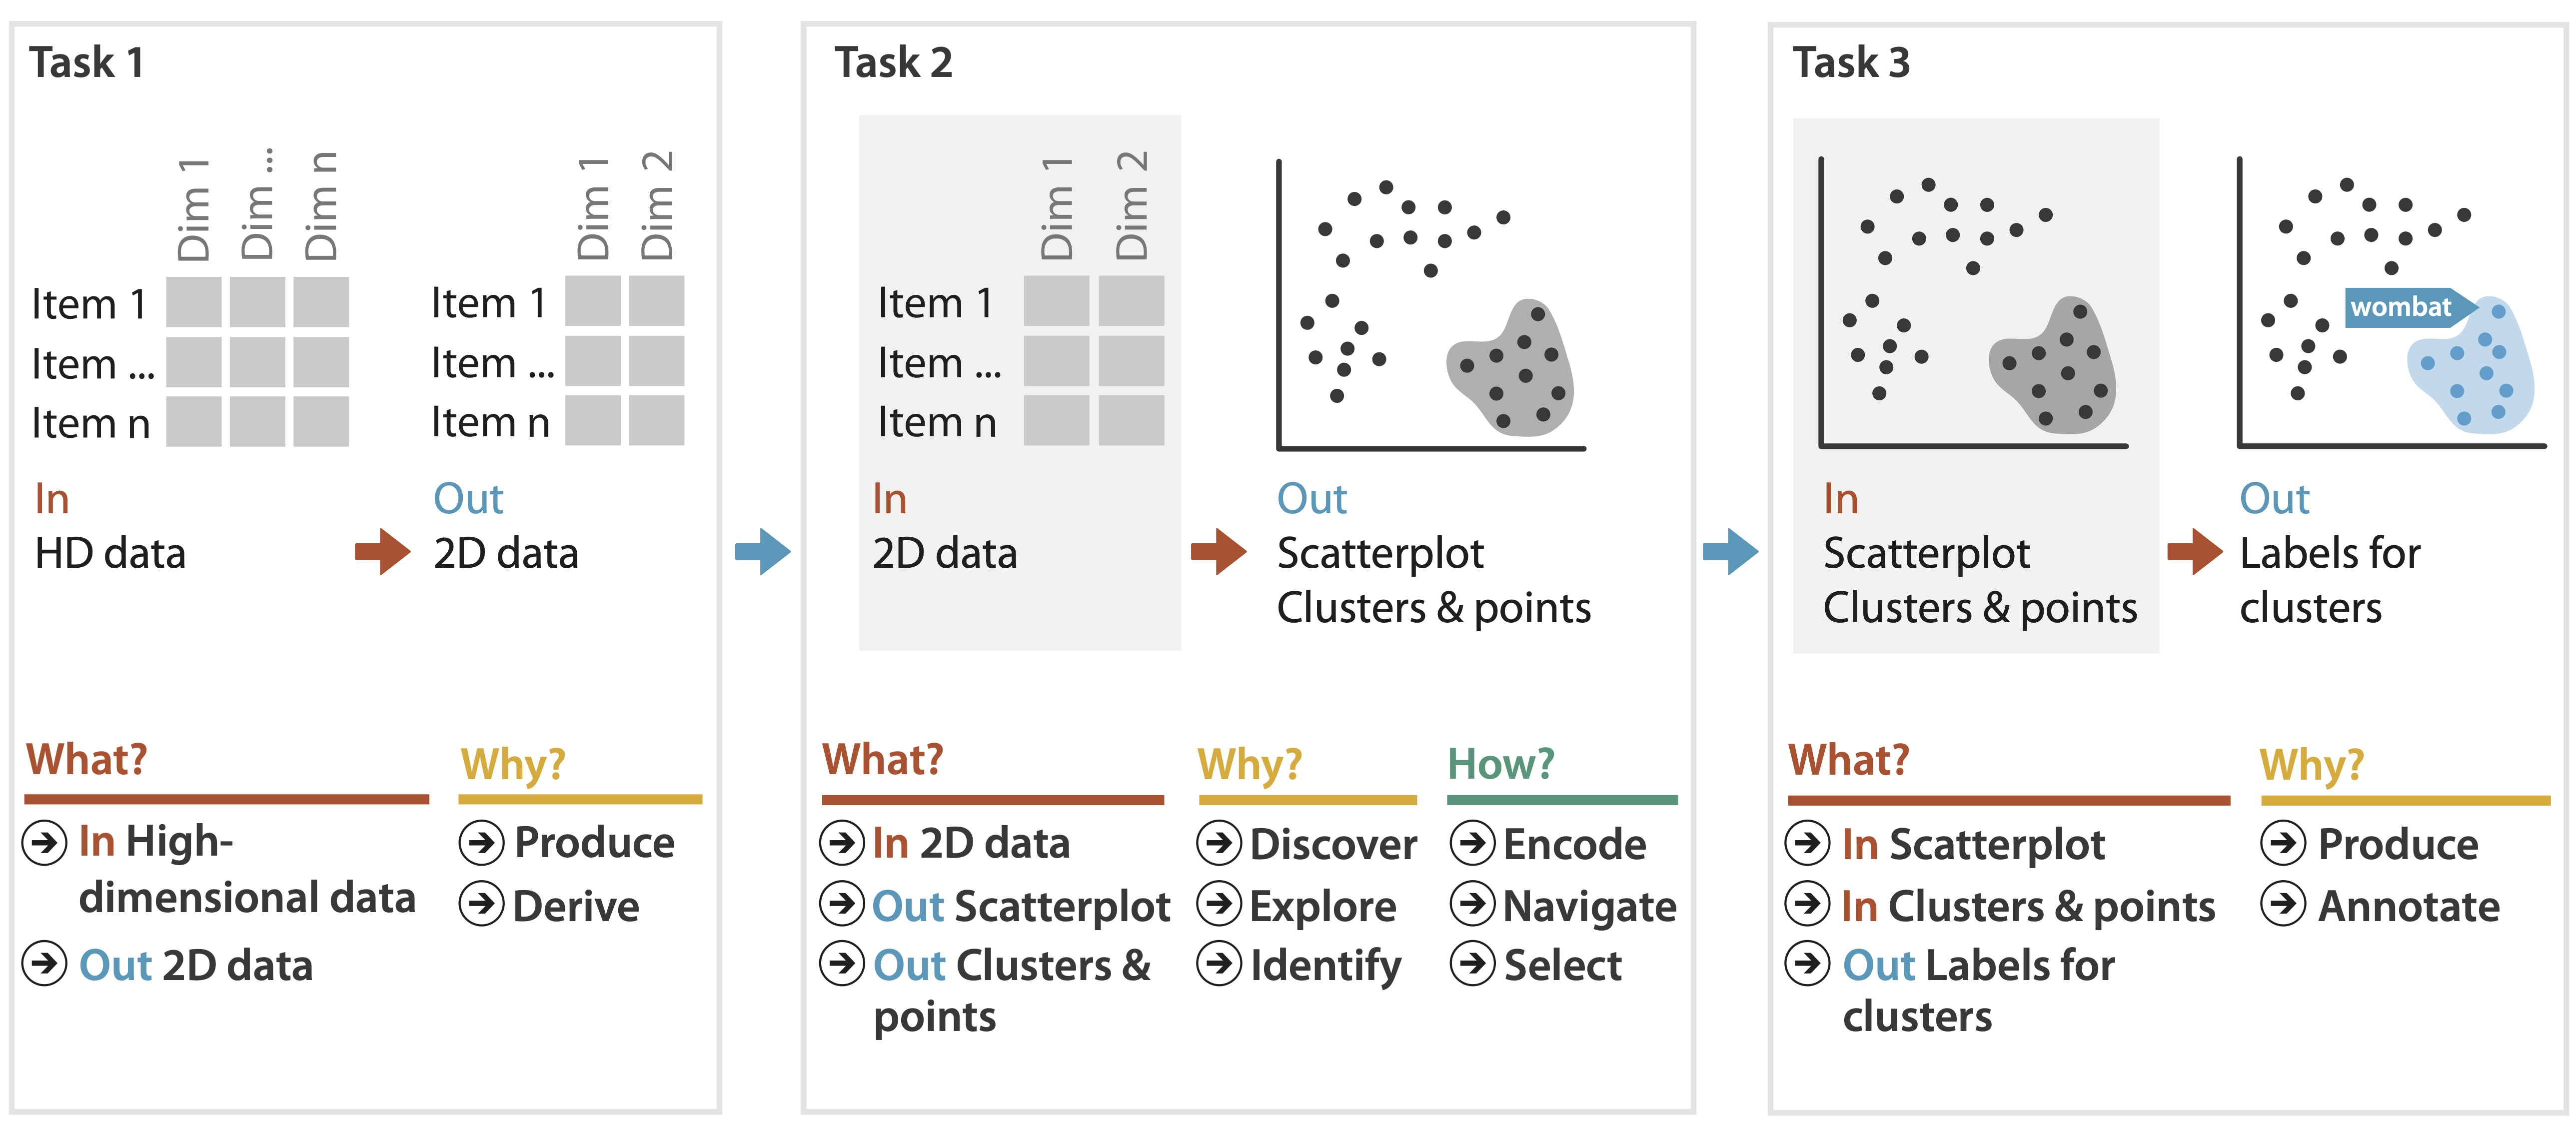
- Abstract tasks when visualizing DR data
- Dimension-oriented tasks
- Naming synthesized dimensions, mapping synthesized dimensions to original dimensions
- Cluster-oriented tasks
- Verifying clusters, naming clusters, matching clusters and classes
Linear Dimensionality Reduction
- Principal components analysis (PCA)
- Finding axes: first with most variance, second with next most, etc.
- Describe location of each point as linear combination of weights for each axis
- Mapping synthesized dimensions to original dimensions
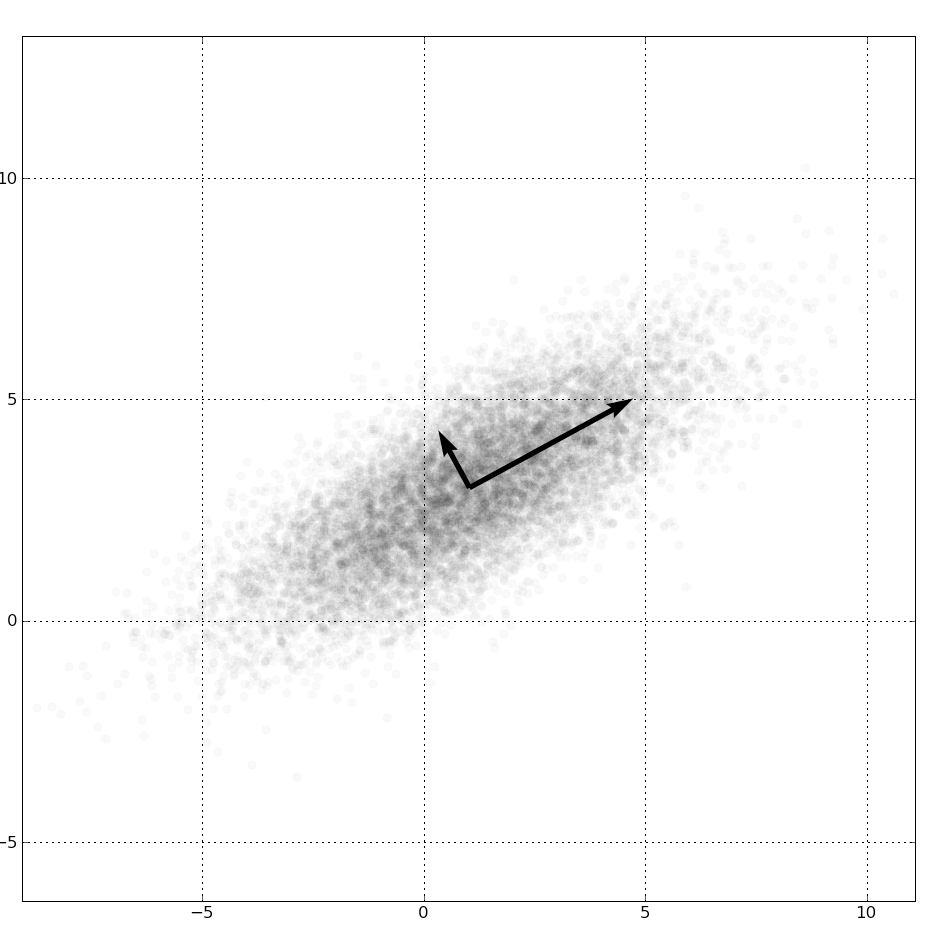
![[http://en.wikipedia.org/wiki/File:GaussianScatterPCA.png]](https://en.wikipedia.org/wiki/File:GaussianScatterPCA.png)
Nonlinear Dimensionality Reduction
- Pro: can handle curved rather than linear structure
- Con: lose all ties to original dimensions/attributes
- New dimensions often cannot be easily related to originals
- Mapping synthesized dims to original dims task is difficult
- New dimensions often cannot be easily related to originals
- Many techniques proposed
- Many literatures: visualization, machine learning, optimization, psychology, etc.
- Techniques: t-SNE, MDS (multidimensional scaling), charting, isomap, LLE, etc.
- t-SNE: excellent for clusters
- But some trickiness remains: a(href="http://distill.pub/2016/misread-tsne/") [How to Use t-SNE Effectively]
- MDS: confusingly, entire family of techniques, both linear and nonlinear
- Minimize stress or strain metrics
- Early formulations equivalent to PCA
t-SNE Explorations
http://distill.pub/2016/misread-tsne/Interactive T-SNE
Embed, Focus+Context
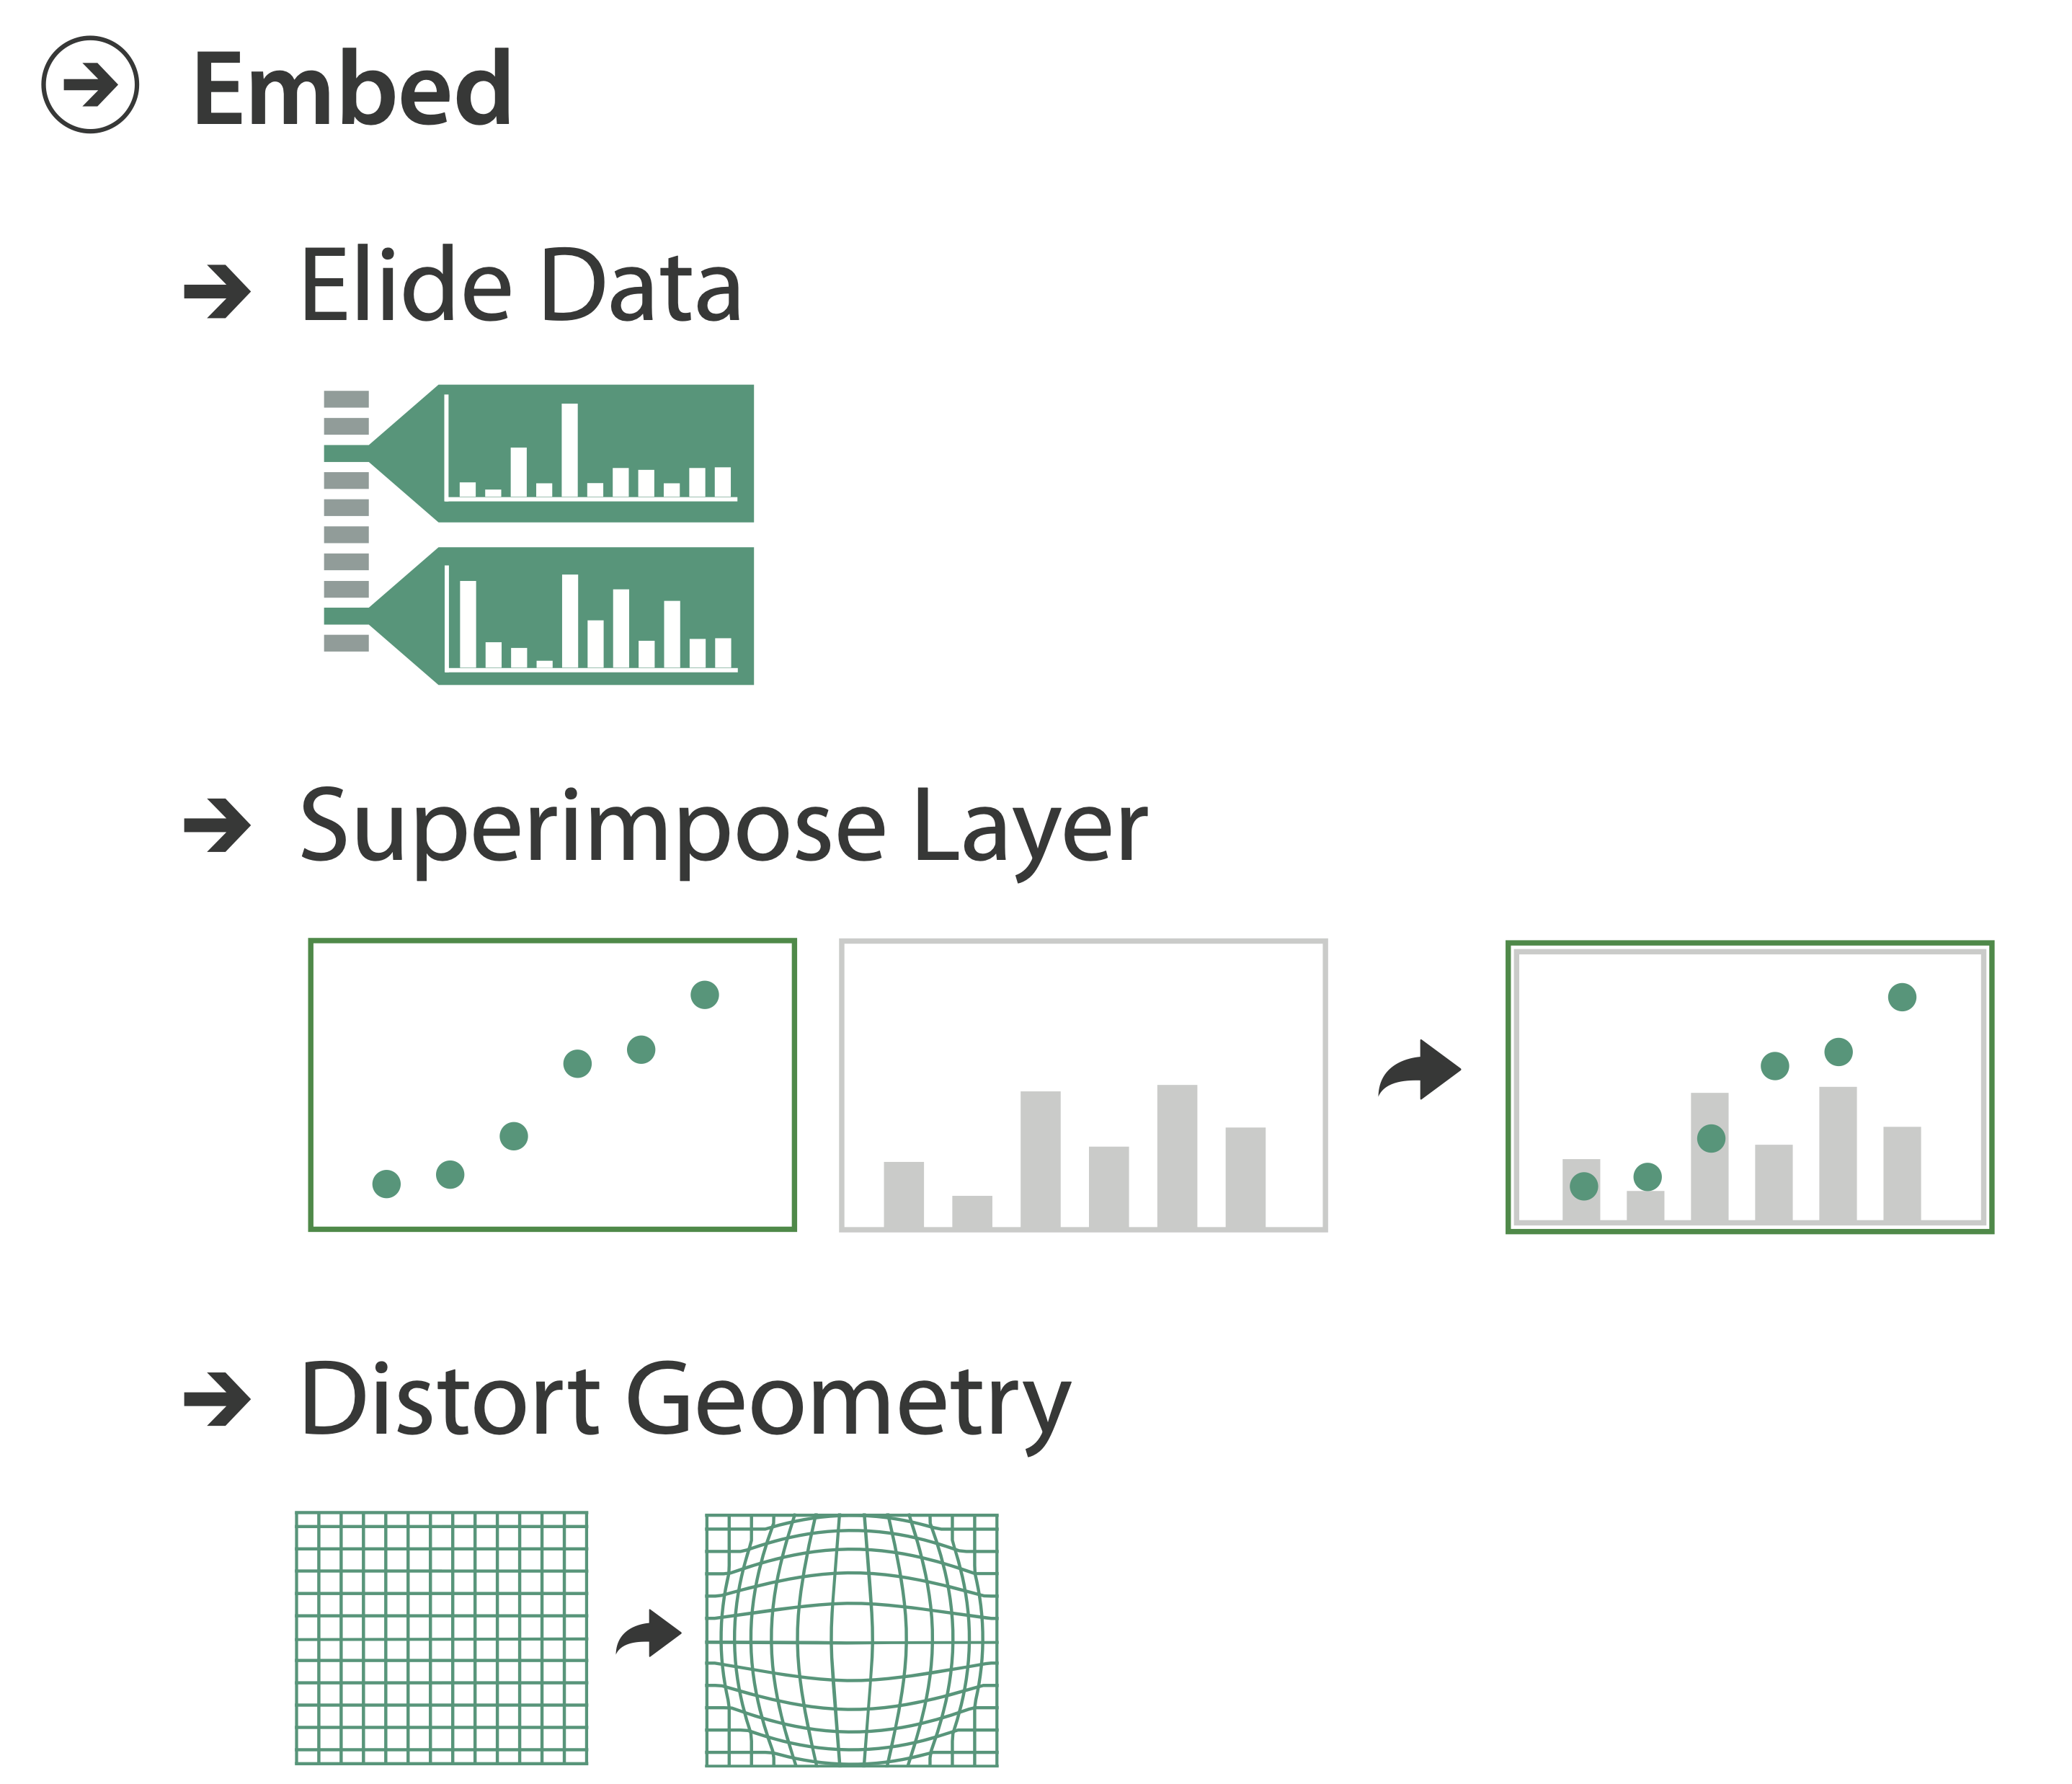
Embed: Focus+Context
- Combine information within single view
- Elide
- Selectively filter and aggregate
- Superimpose layer
- Local lens
- Distortion design choices
- Region shape: radial, rectilinear, complex
- How many regions: one, many
- Region extent: local, global
- Interaction metaphor
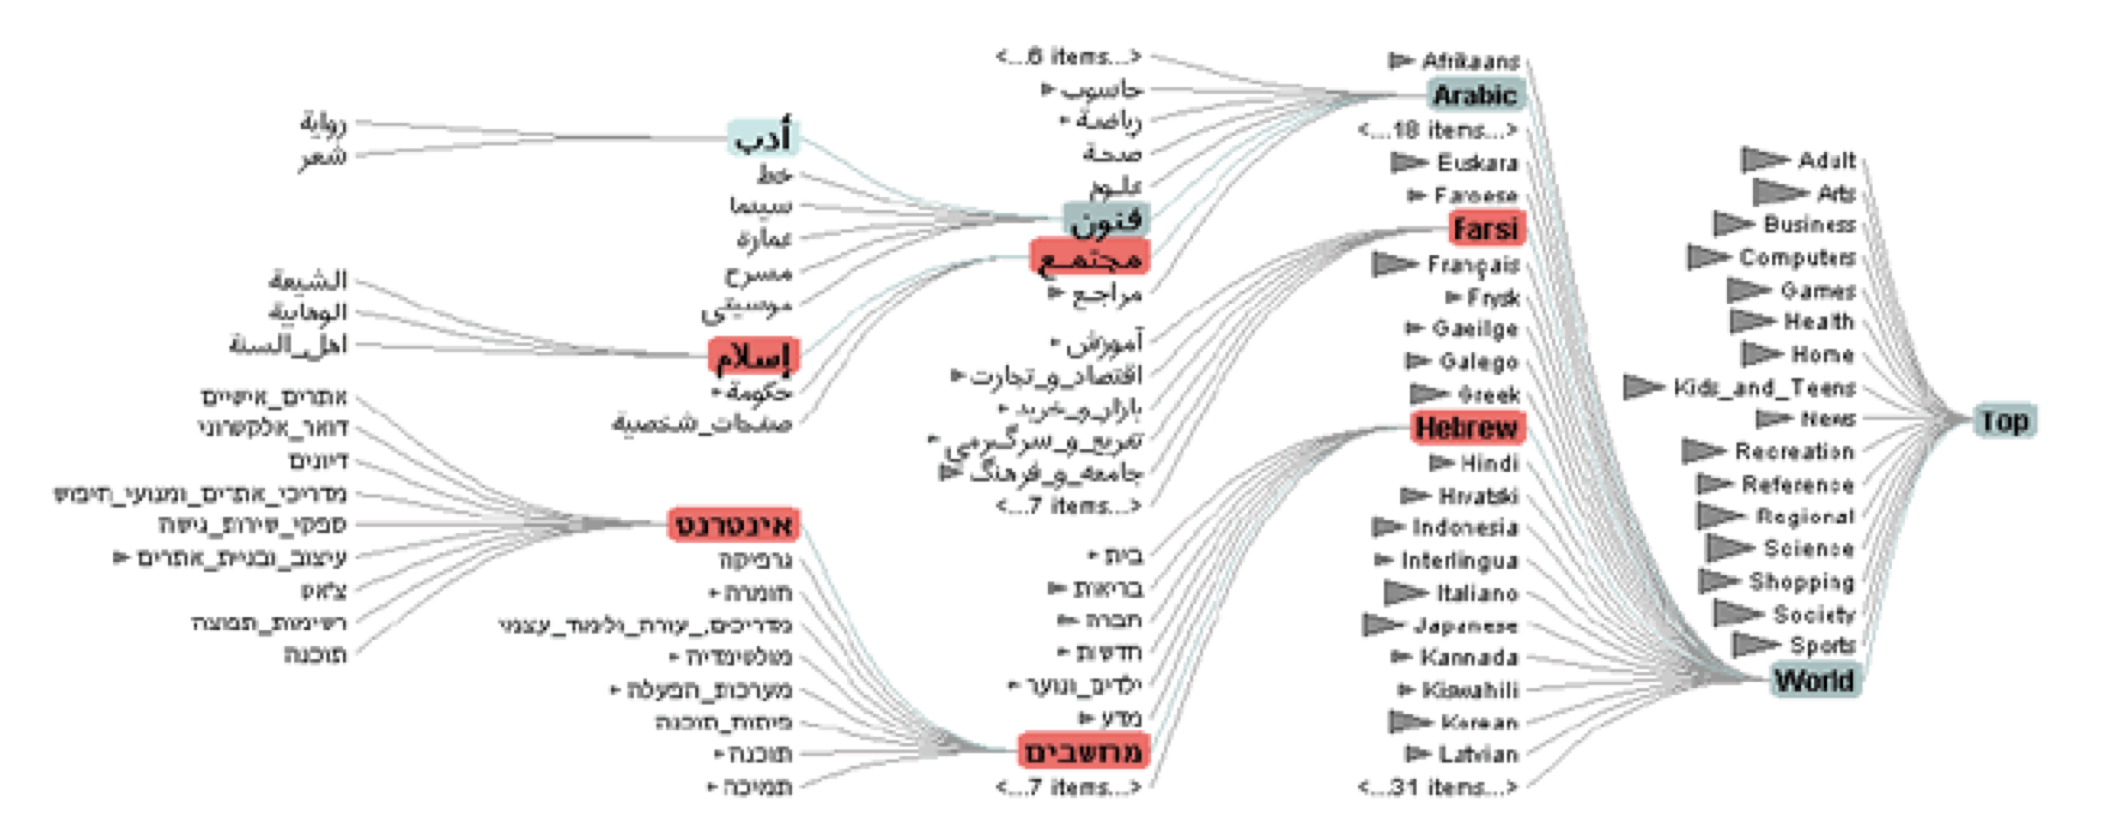
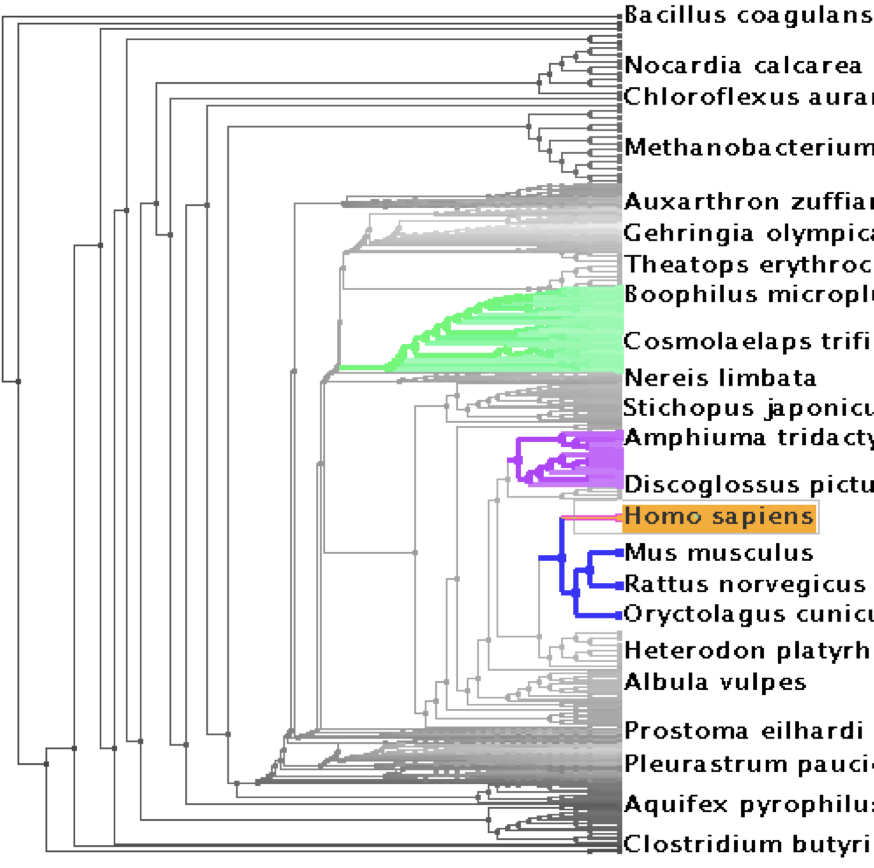
Idiom: DOITrees Revisited
- Elide
- Some items dynamically filtered out
- Some items dynamically aggregated together
- Some items shown in detail
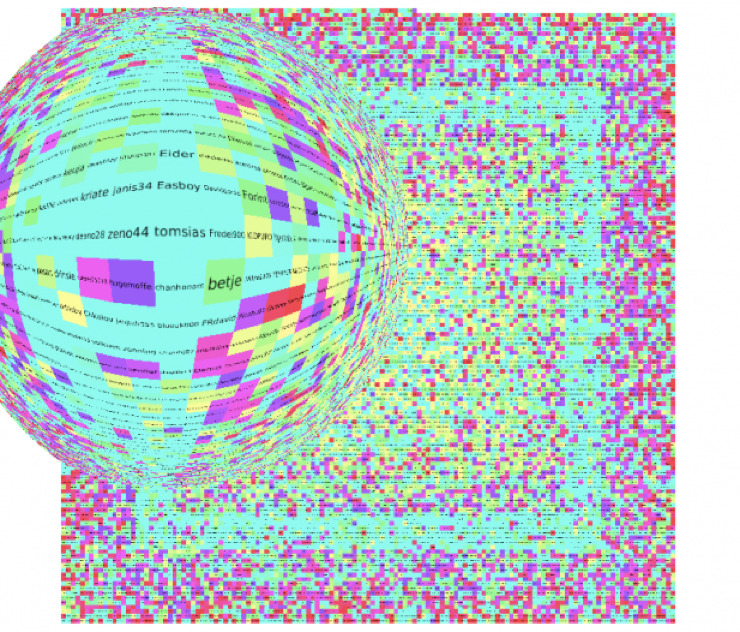
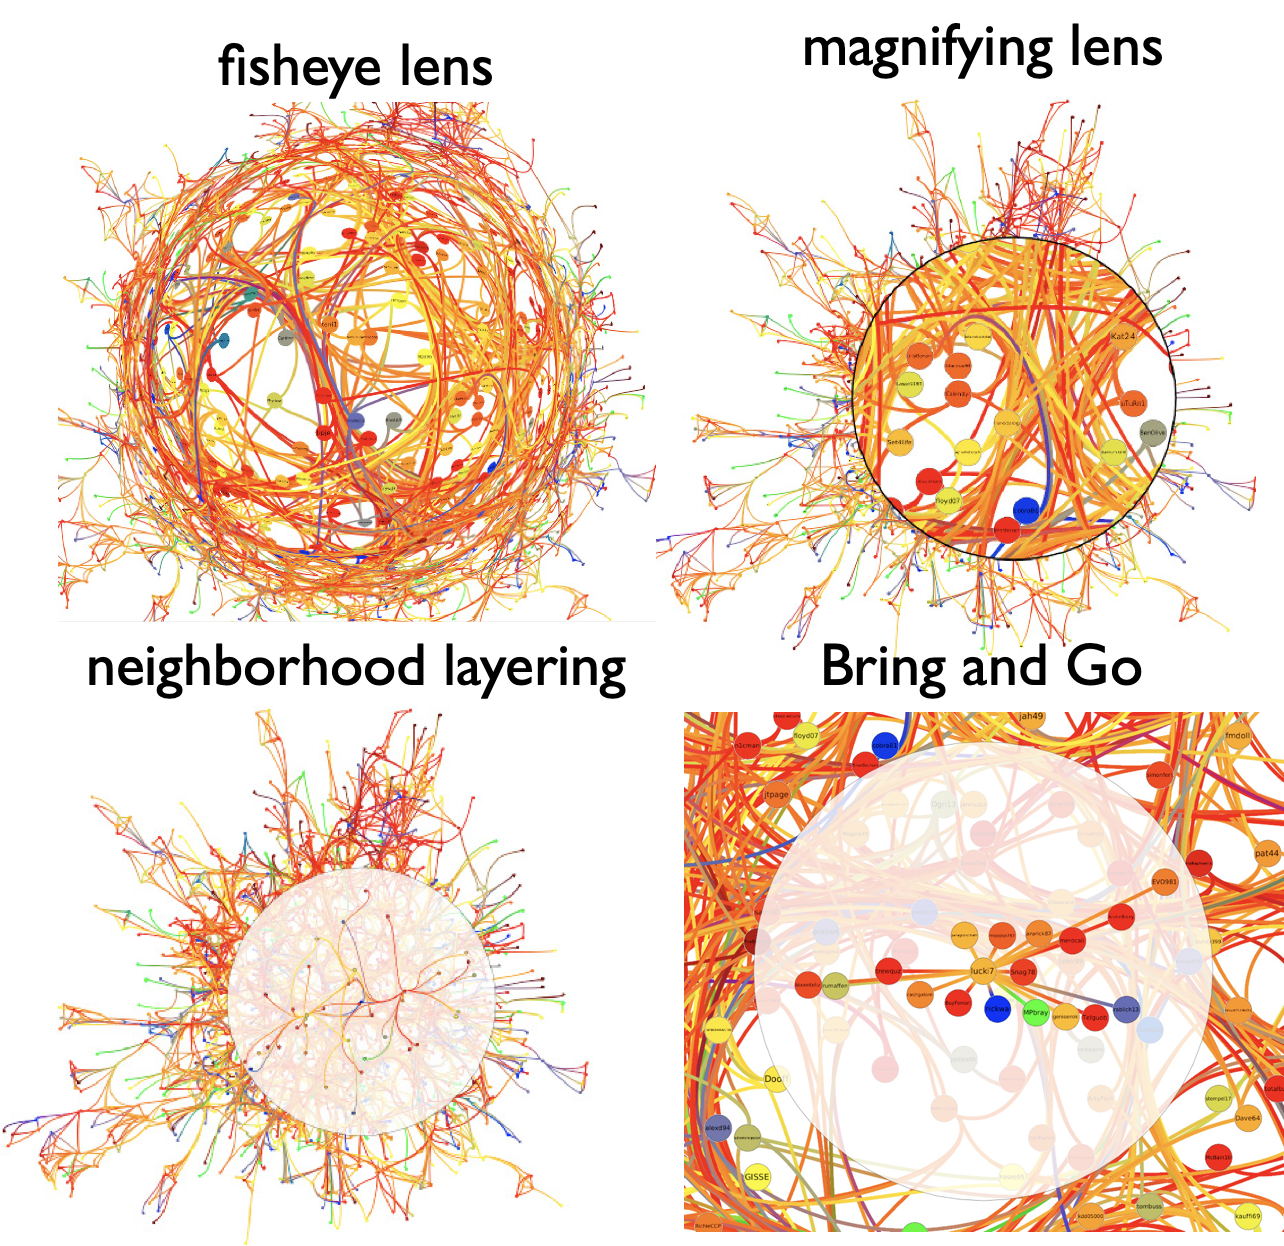
Idiom: Fisheye Lens
- Distort geometry
- Shape: radial
- Focus: single extent
- Extent: local
- Metaphor: draggable lens
Fisheye
https://bost.ocks.org/mike/fisheye/by mbostockIdiom: Stretch and Squish Navigation
- Distort geometry
- Shape: rectilinear
- Foci: multiple
- Impact: global
- Metaphor: stretch and squish, borders fixed
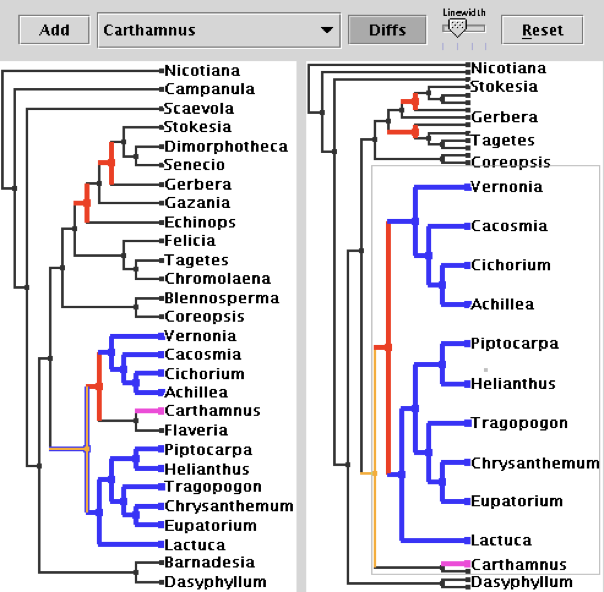
Distortion Costs and Benefits
- Benefits
- Combine focus and context information in single view
- Costs
- Length comparisons impaired
- Network/tree topology comparisons unaffected: connection, containment
- Length comparisons impaired
- Effects of distortion unclear if original structure unfamiliar
- Object constancy/tracking may be impaired
Exploratory Data Analysis (EDA)
What's in the Data?
Tukey
Exposure, the effective laying open of the data to display the unanticipated, is to us a major portion of data analysis. Formal statistics has given almost no guidance to exposure; indeed, it is not clear how the informality and flexibility appropriate to the exploratory character of exposure can be fitted into any of the structures of formal statistics so far proposed.
Nothing—not the careful logic of mathematics, not statistical models and theories, not the awesome arithmetic power of modern computers—nothing can substitute here for the flexibility of the informed human mind. Accordingly, both approaches and techniques need to be structured so as to facilitate human involvement and intervention.
Summary Statistics
- Useful to look at clean data that you understand and trust
- Can be misleading
- Remember the datasaurus!
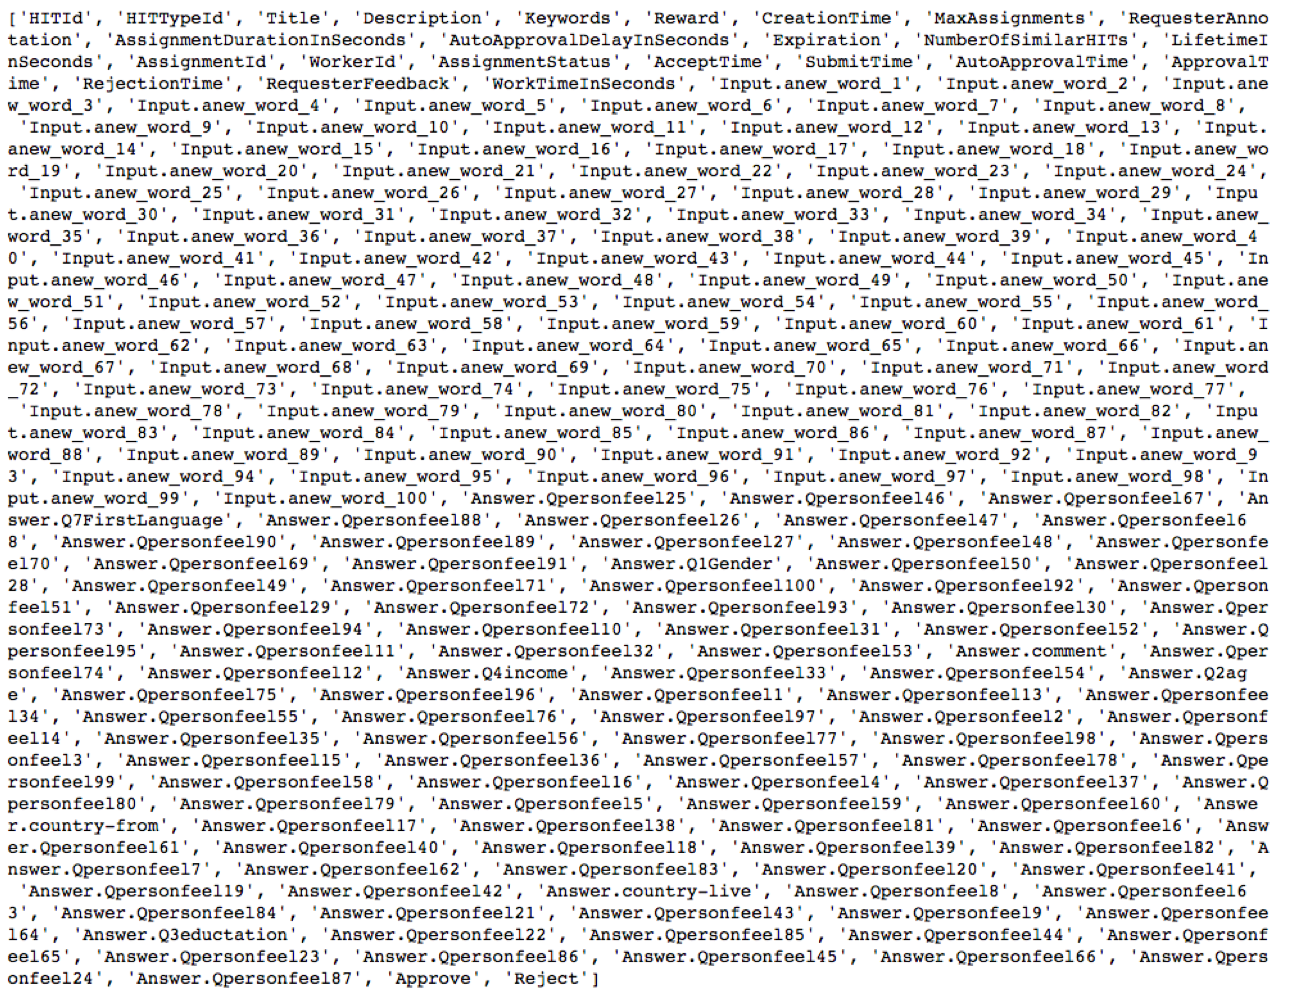
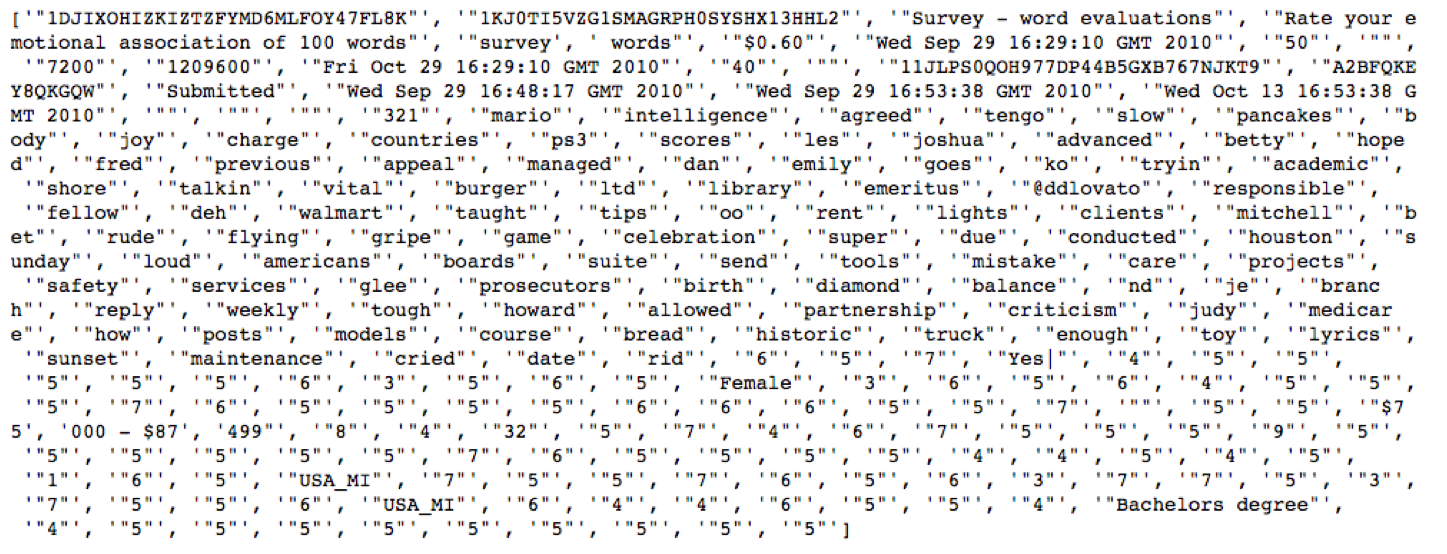
Data Munging
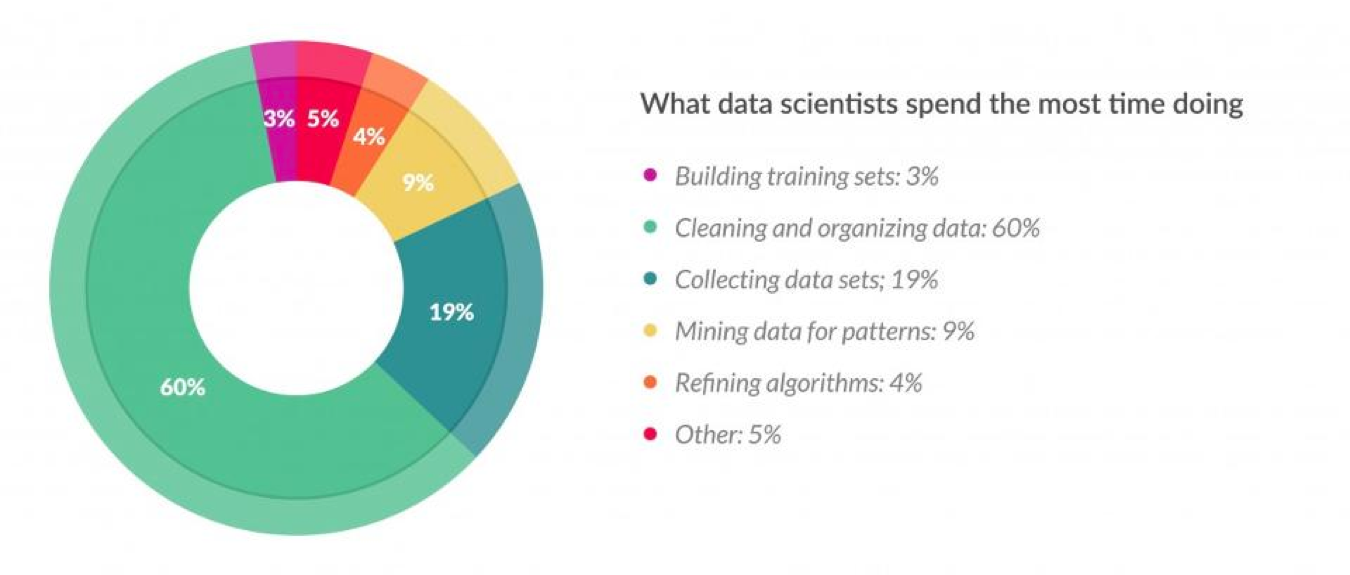
60%
Data Munging
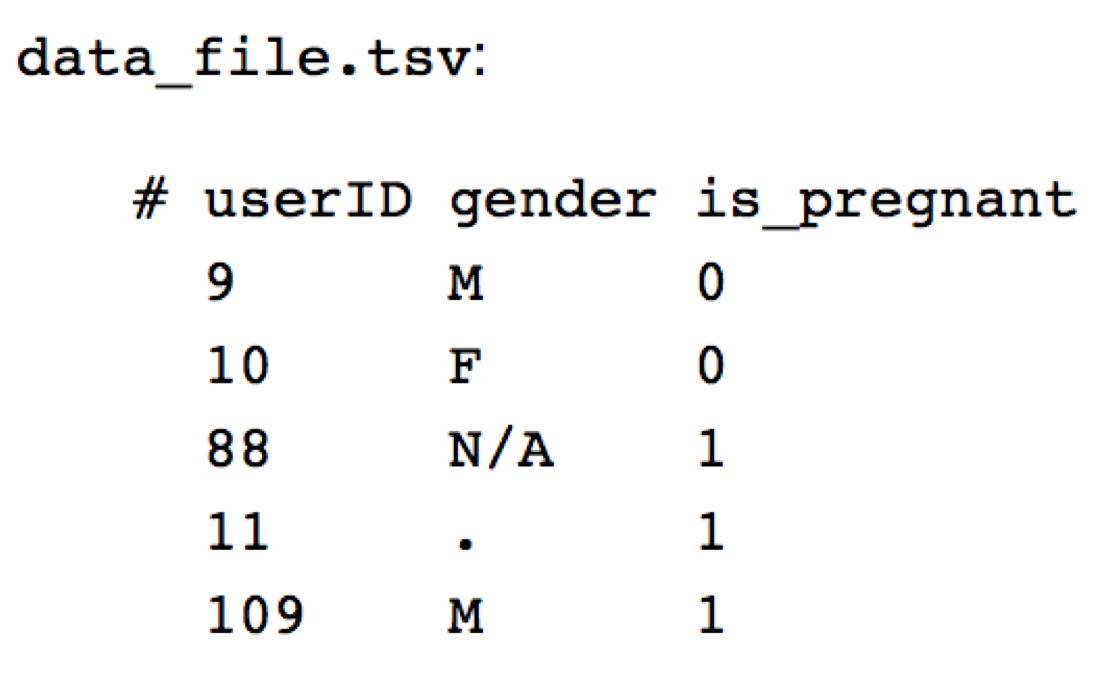
Data Munging (cont.)
Data Quality Hurdles
- Missing data
- Erroneous values
- Type conversion
- Entity resolution
- Data integration
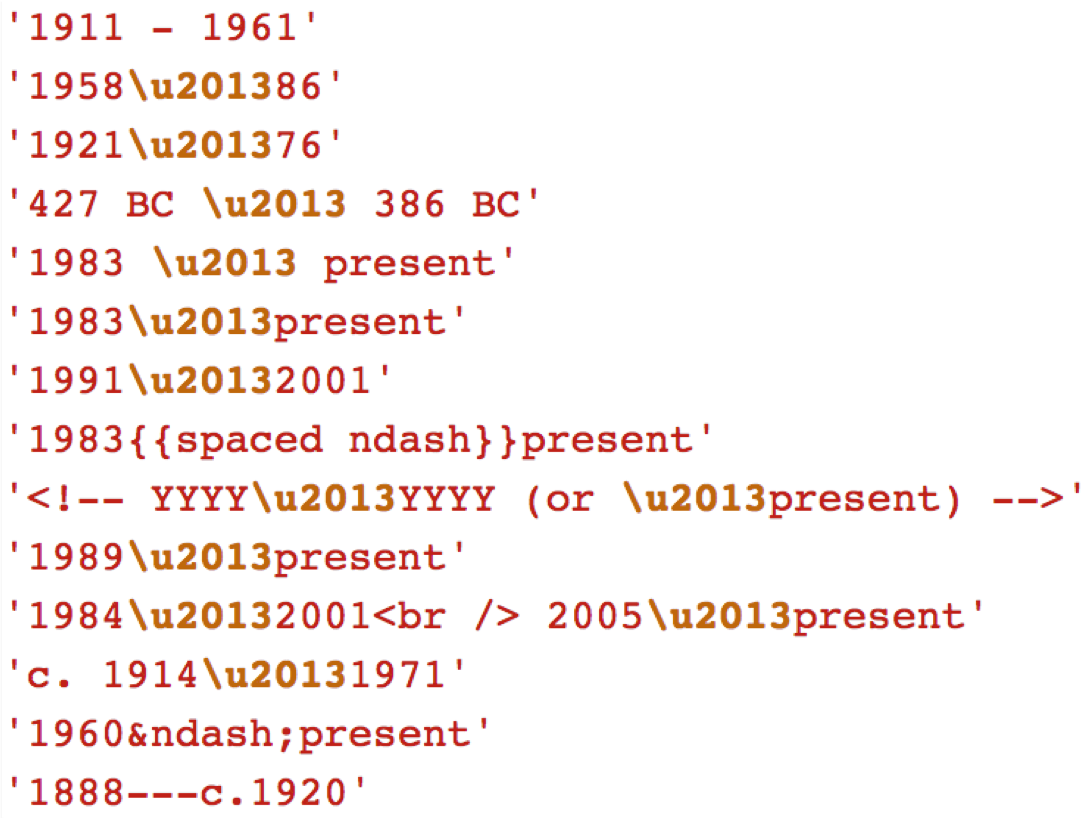
More Bad Data
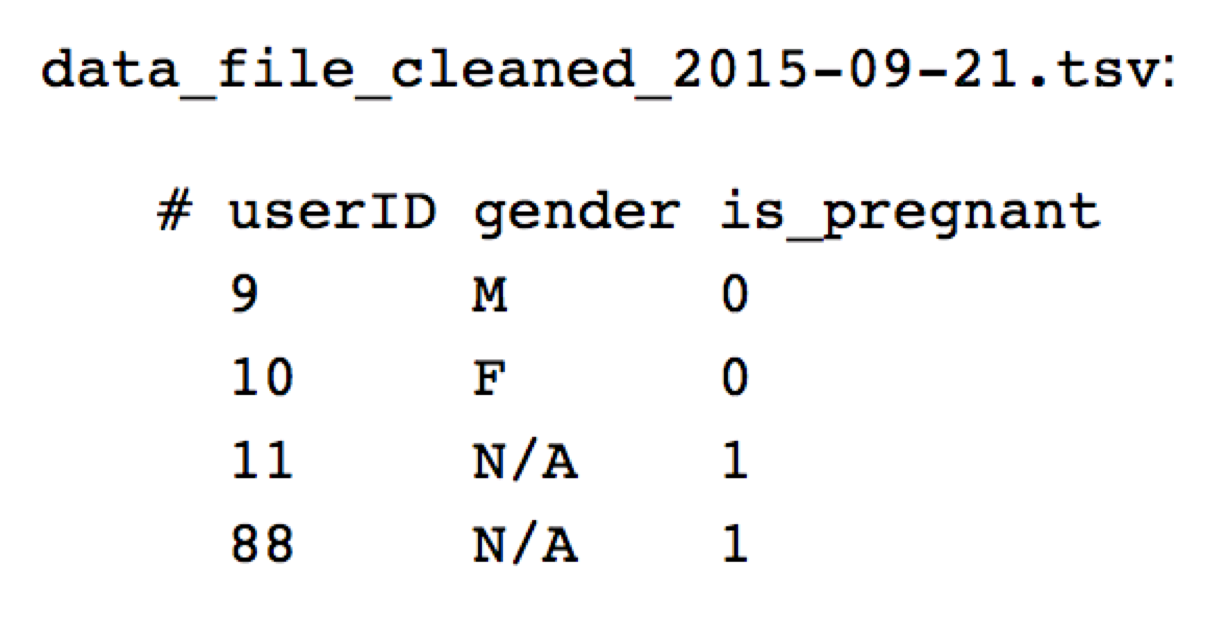
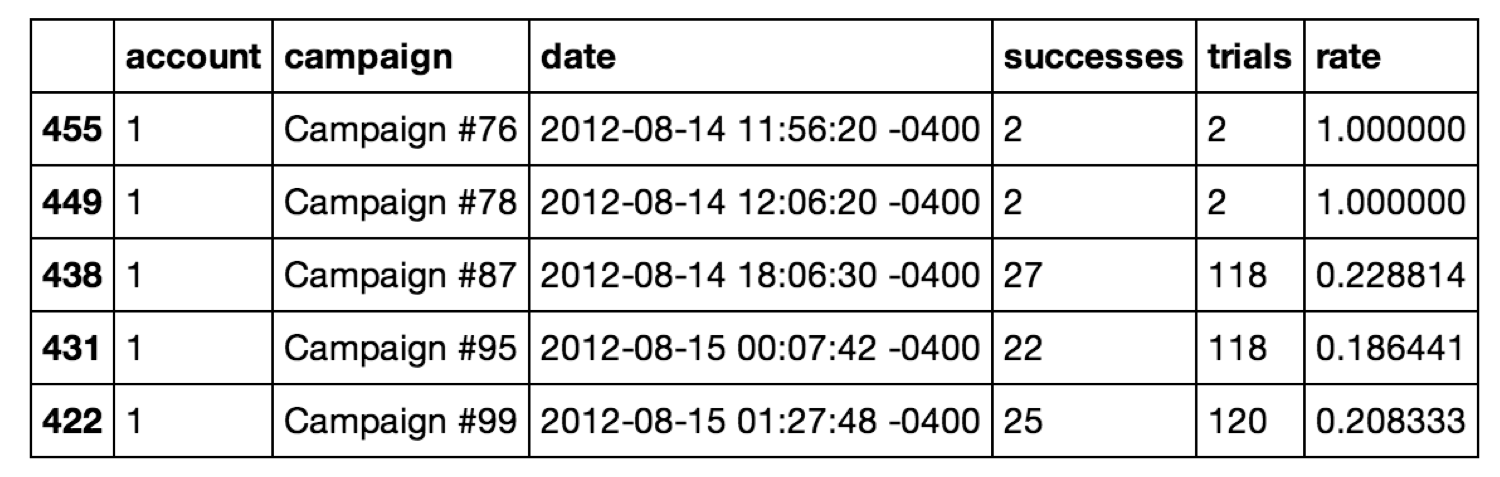
Data Filtering

The First Sign That a Visualization Is Good Is That It Shows You a Problem in Your Data
Wattenberg
Data Tranformations and Iteration
Looks Like This
Think of It as a Data Cube
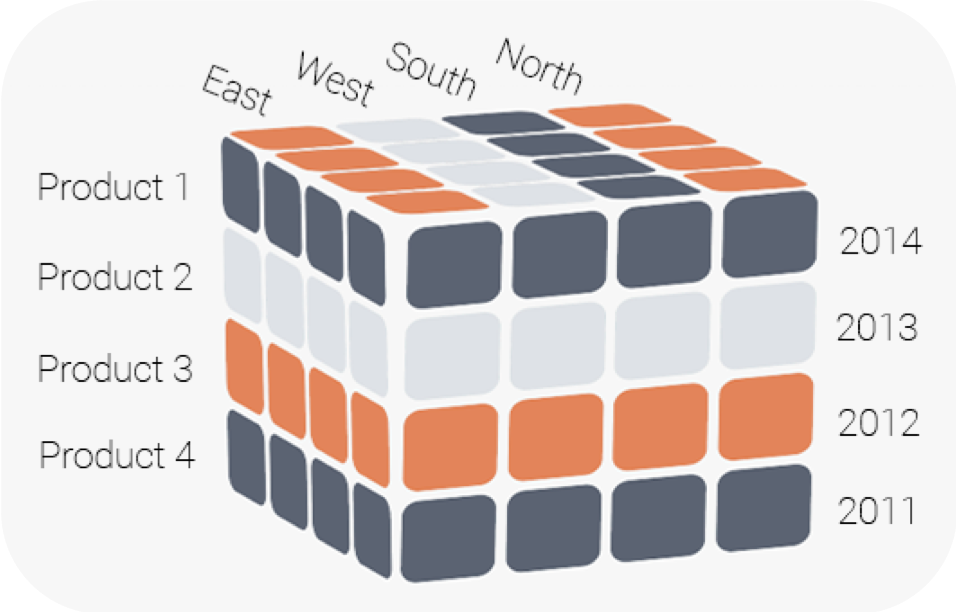
Common Transformations
- Normalize
- Log
- Power
- Binning
- Grouping
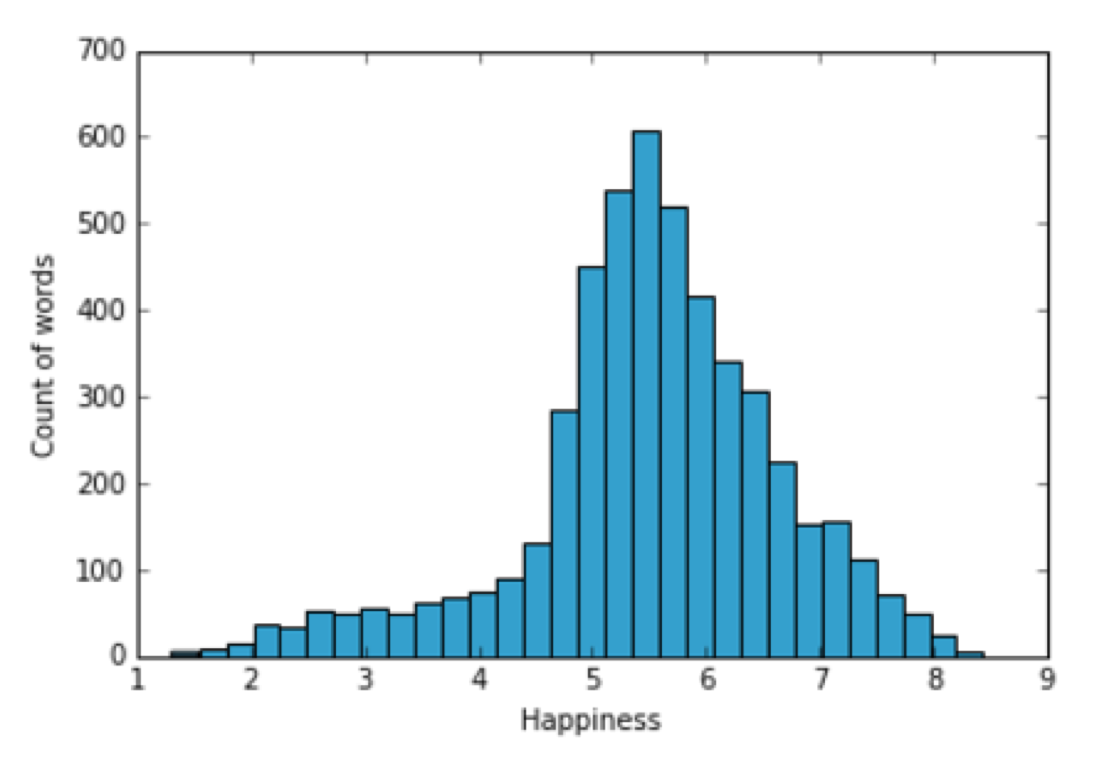
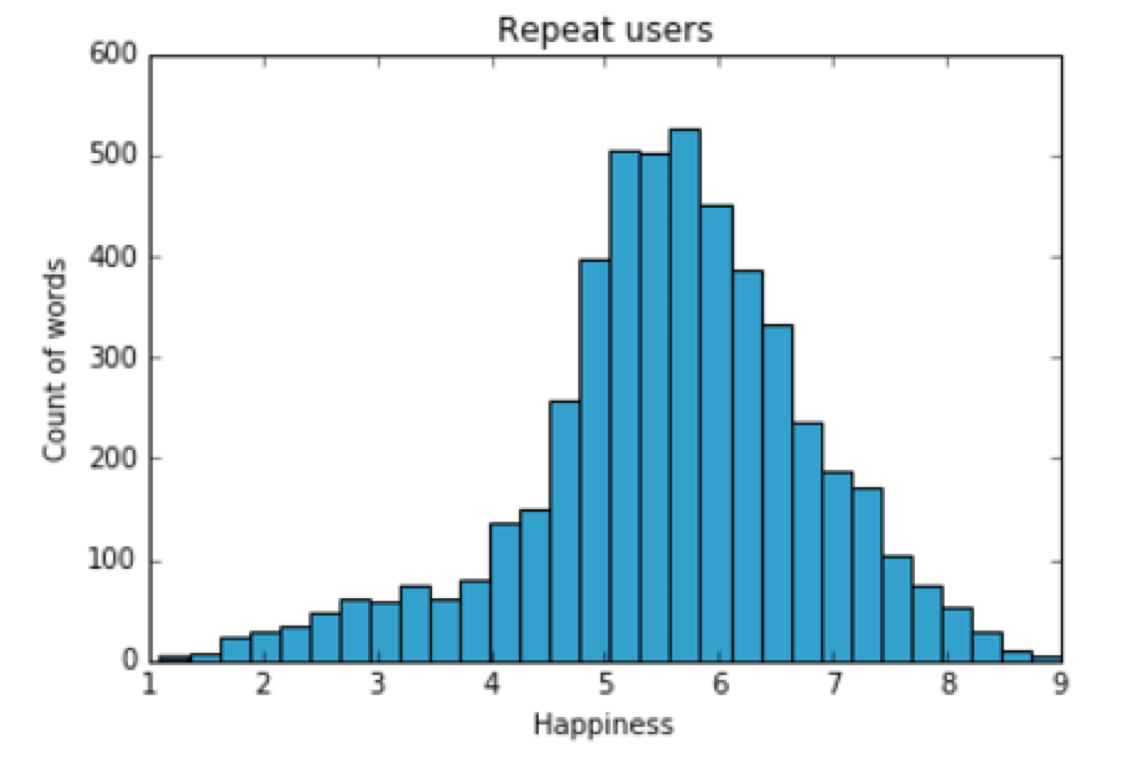
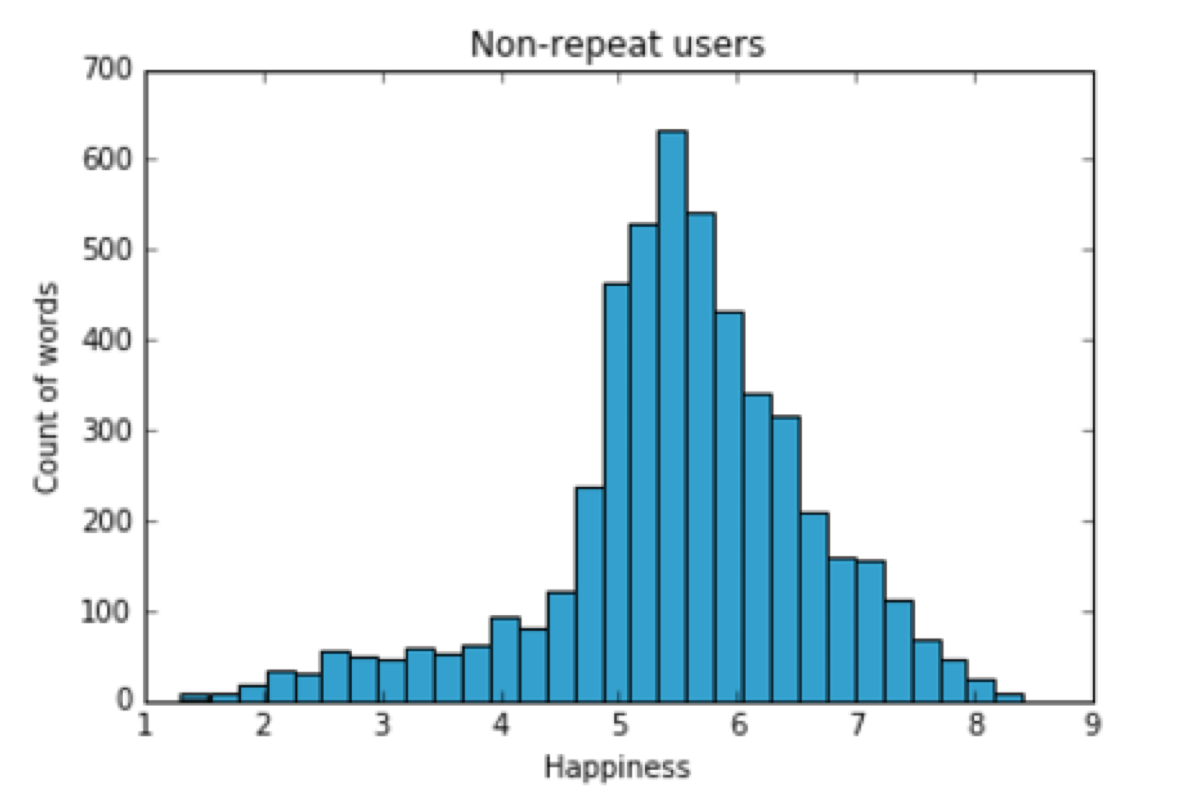
Histograms, histograms, histograms
A cornerstone in the EDA toolbox!
“Above all else show the data.” - Tufte
Correlation
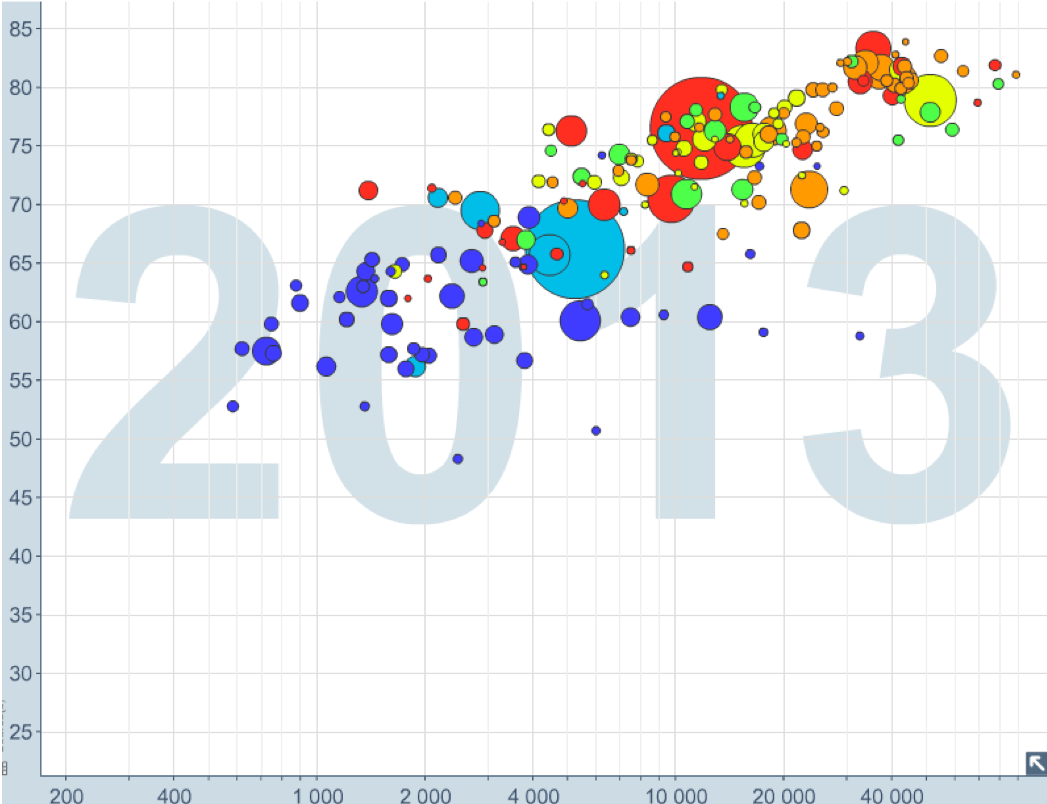
Hypothesis Generation
Mantras
- Be skeptical: What assumptions have been made?
- Explore iteratively: Start simple, keep asking questions.
- Avoid fixation: Use a variety of graphics to inspect more angles.
Paradoxes
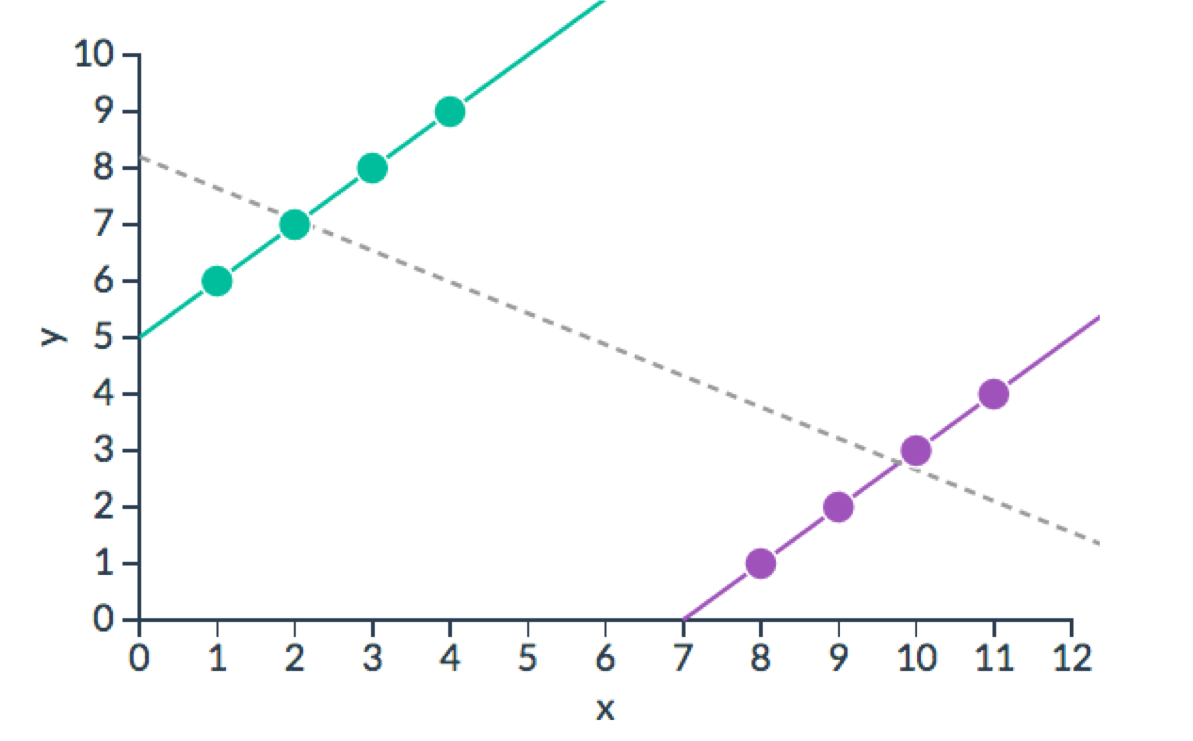
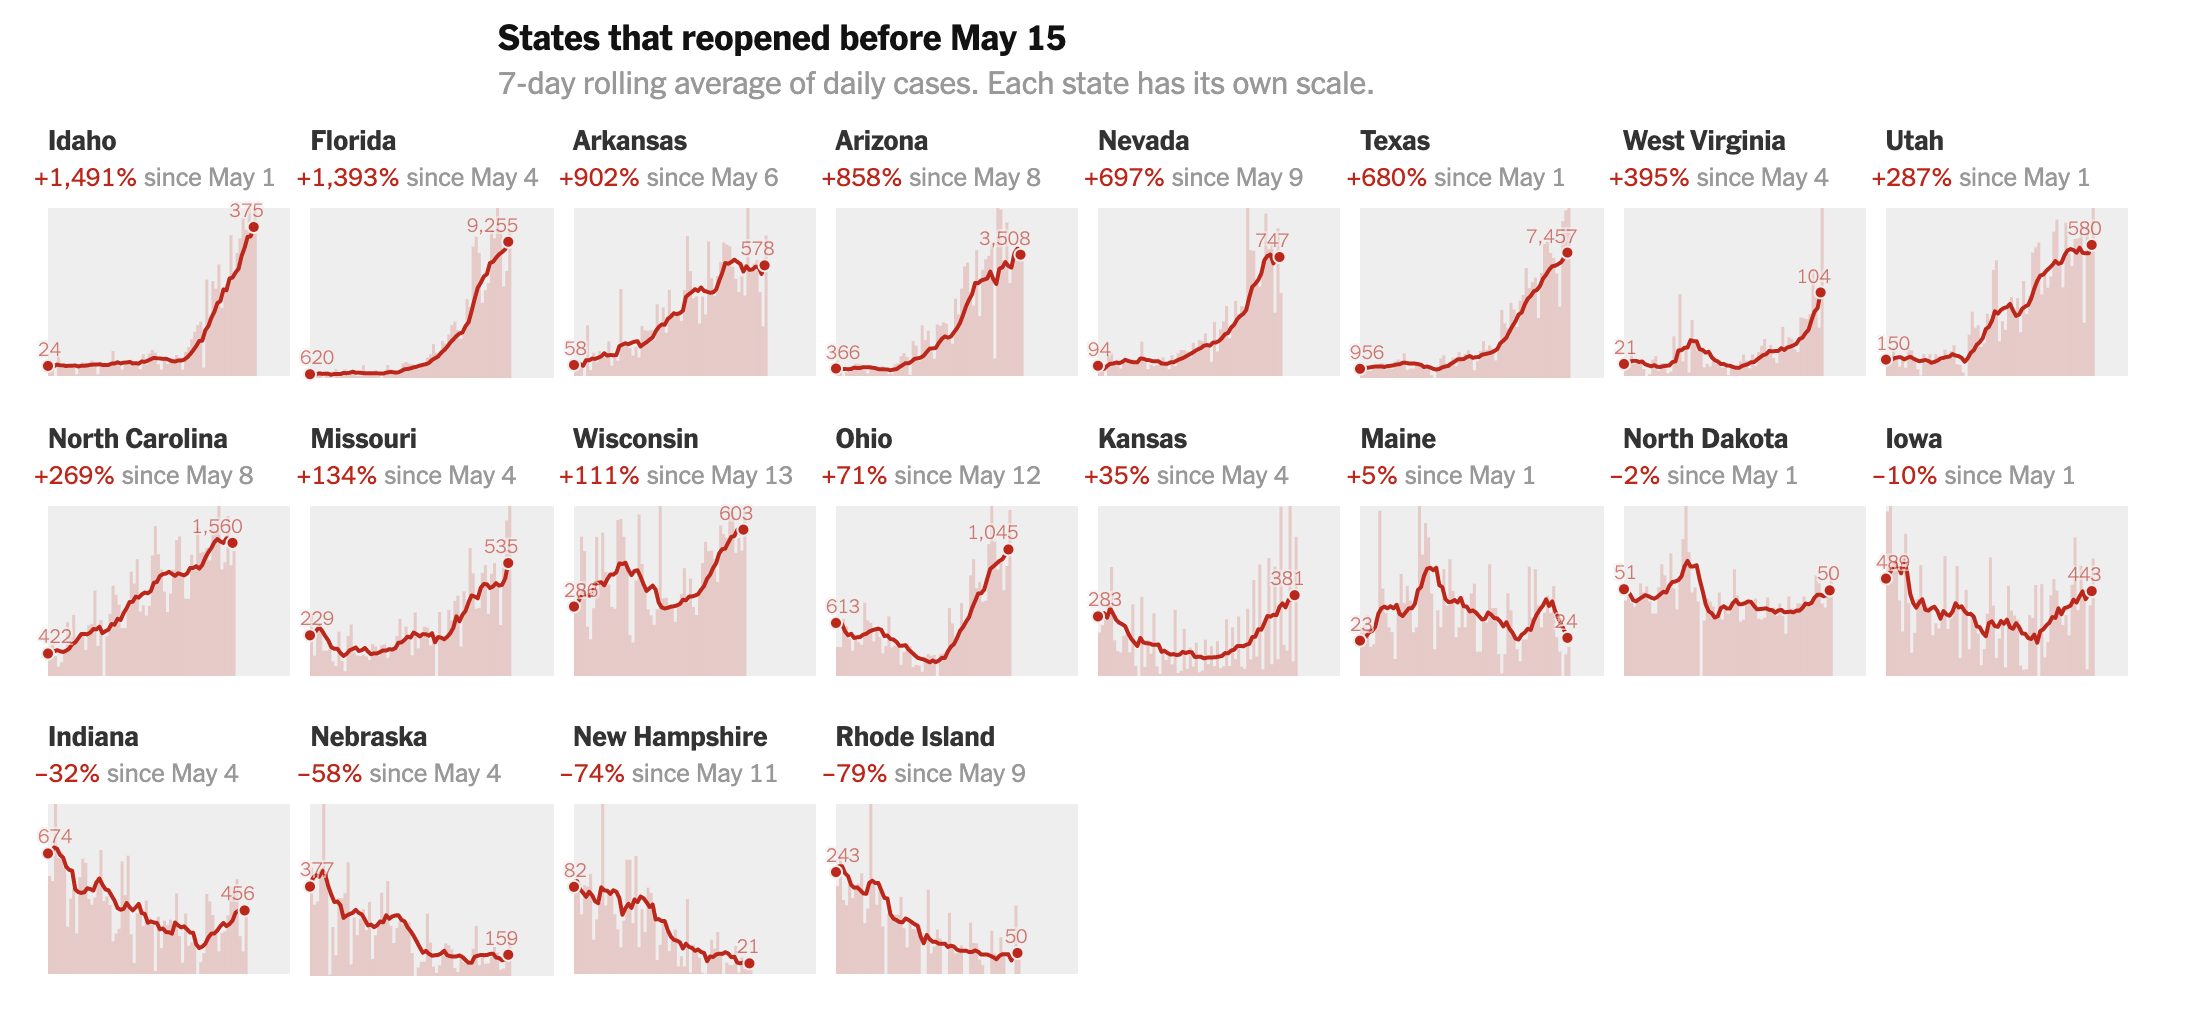
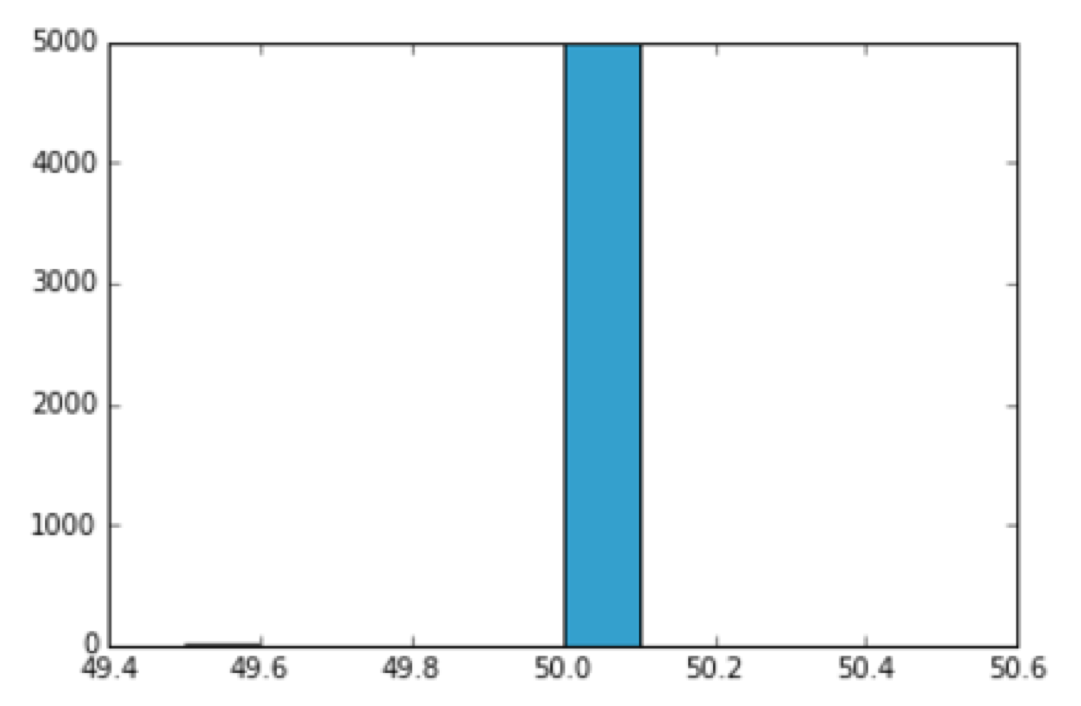
Which One Has the Real Data?
Iteration Demo

Check on NaNs
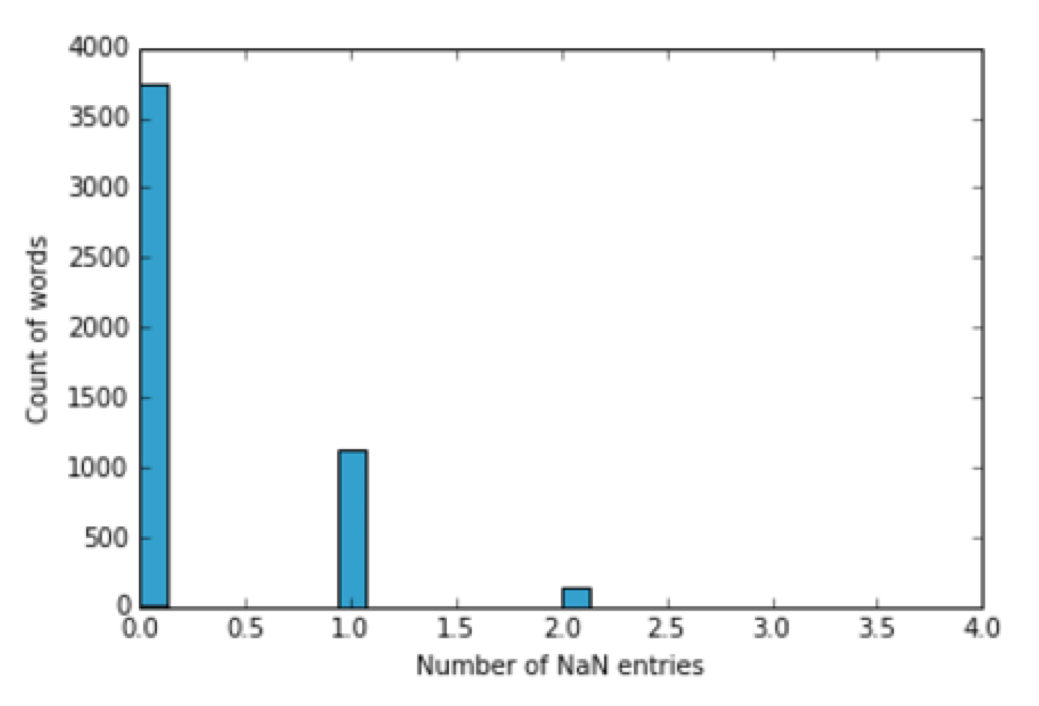
Polyhanna?
What We Learned
- Reduce
- Items
- Attributes
- Aggregation
- Item
- Spatial
- Time
- Dimensionality Reduction
- Embed, Focus and Context
- Exploratory Data Analysis