Advanced visualization concepts
MIDS W209: Information Visualization
John Alexis Guerra Gómez | john.guerra[at]gmail.com | @duto_guerra
Andy Reagan | andy[at]andyreagan.com |@andyreagan
https://johnguerra.co/lectures/MIDS_W209_Information_Visualization/14_Advanced/
Andy Reagan | andy[at]andyreagan.com |@andyreagan
https://johnguerra.co/lectures/MIDS_W209_Information_Visualization/14_Advanced/
Partially based on slides from Tamara Munzner
What We Are Going to Learn
- Traditional Analytics methods
- Clustering
- Regression
- Classification
- Dimensionality reduction
- Recommendation systems
- Visualization + ML
- Business Intelligence Tools
- Deploying your visualizations

Clustering

http://scikit-learn.org/stable/modules/clustering.html#clustering
When to Use It
- When you want to find similar items
- Depends on your distance metric
- When you have too many items and you want to aggregate
Examples
- Customer segmentation
- Grouping experiment outcomes

Regression

http://scikit-learn.org/stable/modules/linear_model.html#passive-aggressive-algorithms
When to Use It
- Present (identify/compare) tendency
- Predict values
Regression
http://blockbuilder.org/tmcw/3931800by tmcwExamples
- Stock prices
- Drug response
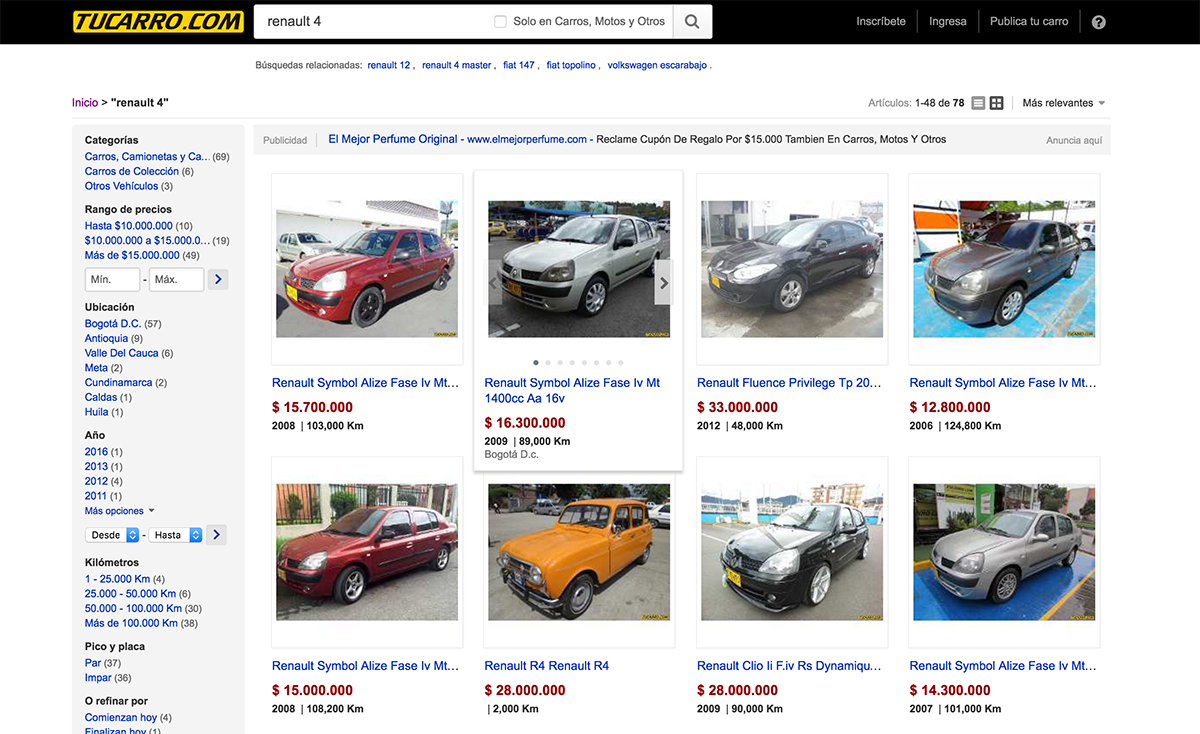
What car to buy?
User: person buying a car
Task: What's the best car to buy?
Data: all cars on sale
Normal procedure
Ask friends and family
Problem
That's inferring statistics from a sample n = 1
Better approach
Data-based decisions
 https://tucarro.com
Jeep Willys
- Colombia bought many Jeeps after the war
- They are the a sort of mountain taxi
- There is a trend to pimp them up


Classification

When to Use It
- Present (identify/compare) tendency
- Present (identify/compare) groups
- Aggregate
- Predict values
Examples
- Photo categorization
- Sentiment analysis
- Spam filtering

Dimensionality Reduction

When to Use It
- Attribute filtering
- Categorize documents (topic modeling)

Recommendation Systems
When to Use It?
- Large catalog with user preference history
- If you like "A" and "B", maybe you will like "C"
Types
- Collaborative filtering
- Content- based systems
- Hybrids
Examples
- Amazon
- Yahoo
- Netflix Prize

How to Use the Algorithms

Vis for ML
Tools
- LIME
- Shapely values
- ...

BI Tools
Tools
- Tableau
- PowerBI
- Microstrategy
- Looker


interview Alex Baldenko (MM)
Alex Baldenko has worked as a lead data scientist, led teams of data scientists, and now leads the data analytics team inside of MassMutual's data science group. They use reliable BI tools to build enterprise-grade analytical systems.

Cloud Deployment
Where
- AWS
- GCP
- Azure
- Linode
- Heroku
- ...
Tools/Technologies
Paradigm: Infrascructure as code.
- Ansible
- Chef
- Puppet
- Terraform
- Cloudformation
- Kubernetes
- Docker
- Vagrant
- ...
Ah!
What/Why/How
A lot of focus on what and how... but why?

Other tools to check
Trifacta
Flourish
Data Wrapper

What We Learned
- Traditional Analytics methods
- Clustering
- Regression
- Classification
- Dimensionality reduction
- Recommendation systems
- Visualization + ML
- Business Intelligence Tools
- Deploying your visualizations